Any command for 2G, related to any BSC can be executed only after log in to BSC first.
After log in to BSC we can execute any command in that particular BSC.
To Log in any BSC :
Command: eaw BSC name;
Example: eaw RBSCHK2;
Now let’s see 4 commands which we can use to get details of E1, KLM in a BSC.
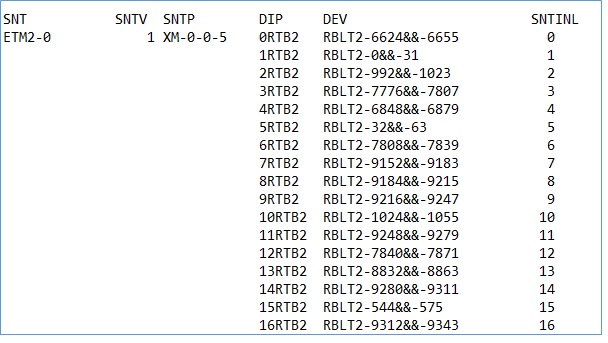
ntcop:snt=all;—————–E1 details/Device detail
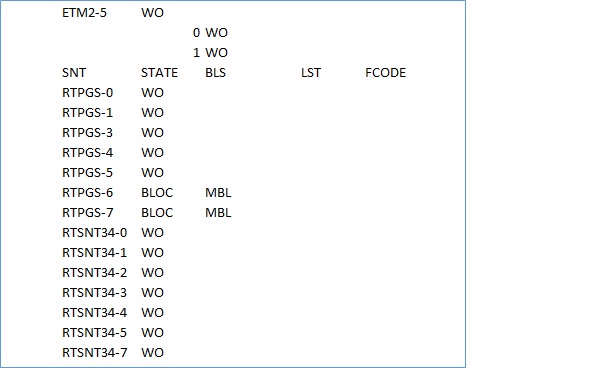
The below screen shot is the output of the command ntcop:snt=all; .Through this command we can get STM wise details for each E1. In a single STM there are 63 E1s. Details of each E1 is available through this command. In the below mentioned screen shot ETM2-0 is the STM name. Then against each E1 DIP, Device (DEV) and SNTILN are mentioned. Against each SNTINL we get KLM details, e.g. KLM against SNTINL 1 is 211 and so on.
Likewise details for all available STMs in that same BSC can be extracted by using this ntcop:snt=all; command.
Here in each example, though I am showing only up to 16 E1 but through the command we will get details of all E1s. (for 1 STM 63 E1, and for all STMs available in the BSC)
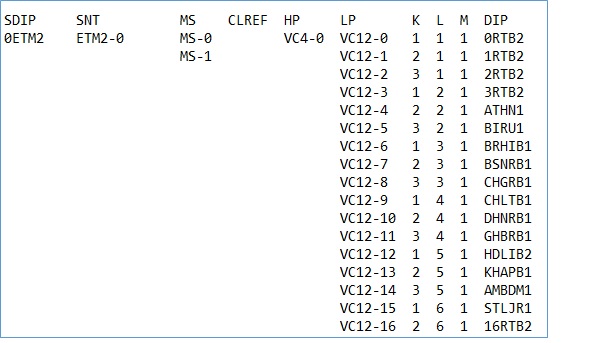
tpcop:sdip=all;——————-SNTINL details
By using tpcop:sdip=all; we can receive below mentioned details. Here also we get STM wise each E1 details for all STMs.
Don’t be confused with the screen shot of above command. Both data are for two different BSCs.
Here KLM actual value is indicated instead of SNTINL number. E.g. VC12-1 has KLM value 211, which represents SNTINL value 1. We don’t get device details through this command.
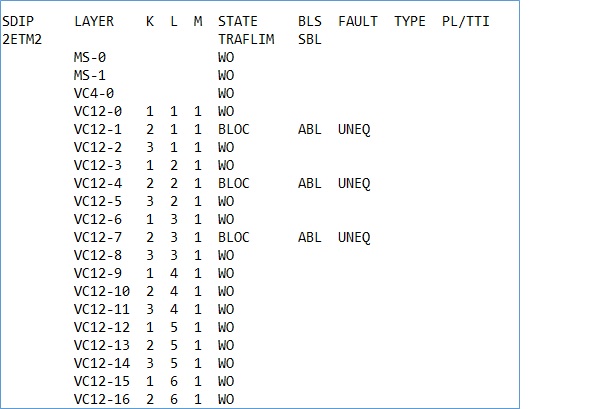
tpstp:sdip=all;—————-E1 status
tpstp:sdip=all; gives E1 status. Which E1 is currently busy/used and which are free. It gives details of each E1 KLM number wise for all STMs. If ABL is mentioned against some E1 then we can check those KLMs for free E1. They may not be free and can show ABL if site is down and currently not working.
So before using ABL mentioned E1, we have to check those KLMs properly.
If instead of ABL (Automatic blocked label), if MBL (Manually blocked label) is indicated against any E1/KLM then those E1 are manually blocked and currently free to use.
ntstp:snt=all;——————HW status
SNT wise, E1/KLM is currently used, or free can be seen by using ntstp:snt=all;
If we use above all three commands to get details of all E1s then we can avoid this command. This command will not give you details for all 63E1s of each STMs.
Conclusion:
These commands are useful to check which E1 are free. Free E1 we can use for site migration from one BSC to another BSC. During site migration we require to know free E1 along with DIP, KLM, attached device details and all. For those purpose these 4, especially top 3 commands are very useful.
A formal definition of Internet of Things is as below:
“”The Internet of Things (IoT) is the network of physical objects that contain embedded technology to communicate and sense or interact with their internal states or the external environment.””
Now let’s understand Internet of Things in very simple
way.
Till now when we say internet based services we
understand connections of different computers and computing devices.
Now the Internet of Things says that the scope of
internet is expanded or going to be expanded beyond computers and computing
devices.
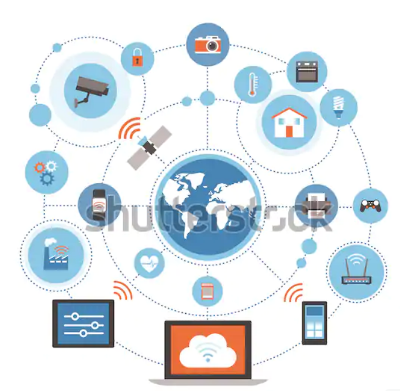
Now whatever “things” we can see, we can touch can be
a part of the internet of world.
They will communicate in between, with humans and so
on.
So in simple terms anything can be connected to the
internet world and this is called Internet
of Things (IoT).
IoT is no more in research state and by 2020 it is
expected that 50 billion devices will be part of IoT.
This count will increase gradually as the use of devices, equipment, home appliances are increasing day by day and they are always more than human beings.
Agriculture: Smart Irrigation, Green House Control
Industry: Indoor Air Quality Monitoring, Machine Diagnosis
Health & Lifestyle: Fitness Monitoring, Wearable Electronics
Market Drivers of Internet of Things (IoT):
IoT is a new game changer for businesses and
individuals and is considered to be the fourth industrial revolution by experts
and scientists.
The drivers and trends that contribute to the massive
growth and development of IoT are as below, but not limited to:
3GPP standards
Expanded and low cost internet
connectivity
Expanded mobile communication
Emerging of new mobile technology
like LTE and 5G.
Low cost sensors
Large IoT investments
Growing importance of Automation
Big data knowledge
Artificial Intelligence
Machine learning
Deep learning
Edge computing and cloud
Security assistance
IPV6 addressing system
Characteristics:
Different characteristics of IoT are:
Efficient,
scalable and associated architecture
Unambiguous
naming and addressing
Abundance
of sleeping nodes, mobile nodes.
Intermittent
connectivity
As we already came to know that in
IoT billions of, trillions of devices are going to be interconnected so, it
must be scalable and as well as efficient too.
Identification
of each nodes must be unique. Currently IPV4 system is usually used for IP
addressing which is having 32 bit addressing scheme.
For IoT we need to think beyond IPV4 and necessity to go for IPV6. IPV6 is having 128 bit addressing scheme.
There should be large number of sleeping nodes in the system.
Whenever they are not being used
they should be in sleeping mode and as per requirement make them active.
As there are large no of nodes
connected in the network it is not possible to check and change battery or
power supply to the nodes very frequently.
So the battery life of the nodes
should be very large like many years. To make the battery life long, we should
make some arrangement so that all nodes are continuously not active and go to
sleep mode when they are not required to be active.
By this way we can make long
battery life of the nodes and thus make them long live.
Mobility
of the nodes is also a part of IoT network.
e.g. if a person is wearing a smart
watch, along with the person that nodes must also be mobile and should work
properly during mobility.
Intermittent
Connectivity means one device currently connected to a particular
device may not be connected to it at a later instance of time and gets connected
to some other new device or devices.
IoT Market Share:
IoT is attractive in different application domains.
A study found that currently the IoT market share in
different domains are like (Source: Intel)
Manufacturing/
Business: 40.2%
Healthcare:
30.3%
Retail:
8.3%
Security:
7.7%.
So we have seen that currently Manufacturing /Business is on the top of the IoT market share.
It improves overall supply chain management, different
sensors, actuators, different robotic machinery can be used to improve the business process.
In healthcare
remote areas can be connected to the different health care facilities of
doctors, nurses, and other services whether they are present in front of them
or not.
They will be remotely connected and treated.
Recordkeeping and access remotely to those reports is
also an added advantages to healthcare industry.
In case of Retail
sectors tasks such as inventory tracking, smartphone purchasing, anonymous
analytics of consumer choices, these are the different things that can be done
efficiently through use of IoT.
Fingerprint, biometric and facial recognition these technologies can be connected and used with the help of IoT for Security purpose.
Machine to Machine (M2M)
Communications:
Machine to Machine (M2M) communications was first introduced by Telecommunications service providers (TSP).
Earlier IoT was referred to as Machine to Machine
(M2M) communications only.
M2M means devices connected to internet can
communicate to one another through wired and mostly wireless network.
From this concept of M2M with evolved communication technology like 4G-LTE or 5G, concept of MASSIVE IoT deployment comes in to picture.
Along with Massive another part of IoT is CRITICAL IoT.
Massive
IoT:
Requirements of Massive IoT:
Low cost
Low energy
Small data volumes
and Massive numbers of devices.
Examples
are like smart buildings, smart agriculture, logistic tracking and management
etc.
Critical IoT:
Requirements of CriticalIoT:
Ultra-Reliable
Very low latency
Very high reliability
Examples
are like remote health care, traffic safety and control, industrial
applications and control etc.
M2M expansion is growing in very high speed and Cisco predicting that by 2022 there will be 14.6 billion machine-to machine (M2M) IoT connections.
IoT Vs M2M:
M2M refers to the communications between machines and devices.
Internet of Things (IoT) is a wider concept and M2M is a part of IoT, reverse is not.
Expectation of IoT:
Applications of IoT can be expected in almost every sphere of society and any sphere of life.
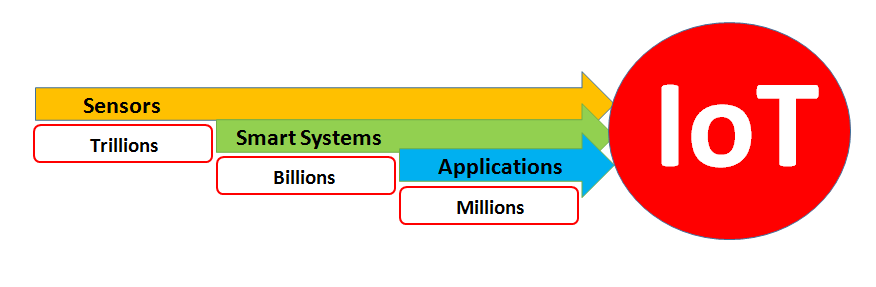
It is expected to have trillions of sensors (nodes), billions of smart systems and millions of applications are going to be internetworked.
Summary:
This is just a beginning of the Internet of Things (IoT) chapter.
In upcoming blogs we will go deep in to the concepts,
theory, devices and applications of IoT in details.
Thanks for reading this blog.
Your feedback, comments, suggestions or like are highly appreciated.
Ref: Internet of Things, A Hands-on approach by Arshdeep Bahga& Vijay Madiset
In Telecom network it is very often required to do the
calculation for the network capacity.
This capacity is mainly required to do an analysis of
the utilization of the network.
What is the current capacity of the network and what
is the status of current utilization of the resources.
In 2G, 3G and 4G (LTE) in all cases we need to find
out capacity of Voice (only for 2G) and Data (Especially for 3G & 4G).
The methods we are going to discuss can be used to do
the calculation before implementation of a network or in existing network.
Here we emphasise mainly to do the capacity calculation for an existing network.
1. Voice Capacity Calculation (2G Network):
Voice
capacity calculation of a site is an old method and most of us are already know
it.
Here
what we do, we do the capacity calculation sector wise, and then add up the
sector values to get site wise total erlang capacity.
Now
take the formula to do the calculation.
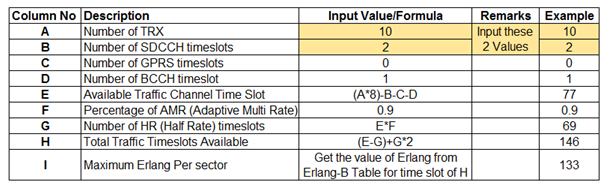
Formula for 1 Sector:
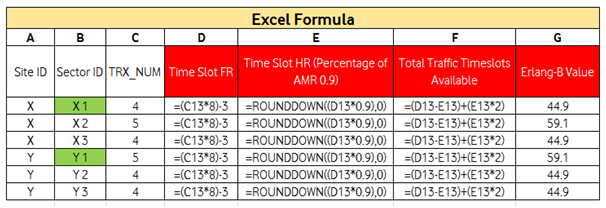
This is a calculation for 1 sector. The column names
mentioned in the table to simplify the formula.
This is a calculation considering HALF RATE (HR) and with Adaptive Multi Rate (AMR).
If we work for FULL
RATE (FR) then we can ignore the columns F, G and H.
Get the Erlang value w.r.t. the timeslot in column E
from Erlang-B table.
Calculation
for the whole Network:
If we have 5000 2G sites in our Network (Just taking a
random example) then we have to sum up the erlang values of all the sectors.
That will become the complete Erlang
(Voice) Capacity or Equipped
Erlang of the network.
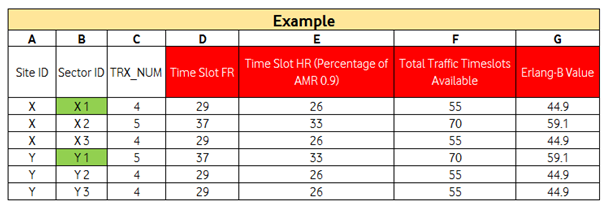
Table: 1
Table: 2
This
is an example of 2 sites each with 3 sectors. Likewise we can do the
calculation for all the sectors of the network and finally sum up the column
“G”. That will become the Erlang
Capacity, Voice Capacity or Equipped
Erlang of the existing network.
After
getting this Capacity now it is easy to find out utilization of sites. We need
to take the traffic data (Cell wise/Site wise) from system generated data and
just divide Traffic by Capacity.
There
is a report which gives Voice and
data capacity of the network.
But sometimes the problem with the report is that, if in any case there are some sites which are down/hold due to some technical /Non-technical issue, capacity of those sites are not considered in the report.
2.Data Capacity Calculation (3G& LTE Network):
Data capacity of a site mainly depends on the
available Bandwidth of the site.
Based on available Bandwidth below is the table which
shows the maximum capacity of a site.
This value may change slightly case to case basis, but
we consider these values as maximum capacity of a site for any calculation
purpose.
Table: 3
Now we can see the below mentioned 6 sites.
Based on site wise technology and bandwidth we will
get a total data capacity of a site.
This total data capacity of the whole network can be
summed up to get the Data Capacity for the whole network, which may contains
any no of sites.
This bandwidth wise data capacity is independent of
frequency band.
For 10 MHz band we will get same 150 GB/site/day for
1800 band or 2100 band 4G sites.
Similar scenario for all other cases too.
Table: 4
Here we are not considering any data for 2G is because
2G data capacity is very low and it is based on the allocation of time slots
for EDGE.
Moreover here we should not confused between data speed
and data capacity. Here we are discussing only about data capacity of a site
not anything about data speed or throughput.
Speed/Throughput altogether is a different concept and
we may discuss in a separate blog.
Utilization:
Again for utilization as we did for 2G traffic. Here
we have to find the actual site wise used payload and divide this value with
the total data capacity.
This may be done site wise or for the whole network.
Here we are considering any telecom circle having the
below mentioned frequency band along with allocated bandwidth.
These figures we are taking just as an example.
Frequency band and allocated bandwidth may vary based
on telecom circle.
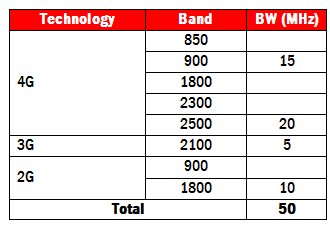
Table: 5
From the above table it is found that for a telecom
circle “X” we have total 50MHz bandwidth.
In 4G total
35 MHz (900 band 15 MHz and 2500-TDD band 20 MHz).
Similarly for 3G
in 2100 MHz band 5 MHz, and for 2G
total 10 MHz in 1800 MHz band.
In this case for calculating site wise bandwidth first
of all we have to find out site wise technology.
In a single site there may be any combination of
technology.
For example we are considering the below mentioned
technology combinations in any site and corresponding site bandwidth.
Table: 6
These technology combinations in a site may vary as
per requirement.
Calculation
for the whole Network (Data & Bandwidth)
In this way we can find site wise total bandwidth.
Once we get site wise data
and bandwidth now we can do all types of permutation combination.
Like District wise, state wise, town wise requirement
of data for capacity and Utilization calculation.
Showing of Bandwidth utilization is bit different from
all other cases. Suppose we need district wise or town wise or may be any
category wise Bandwidth utilization. In that case we can’t do the same
calculation as like voice and data.
Please check the below mentioned table:
Table:7
If in a district named “X” has only 2G sites (here in this example showing 2G sites) then bandwidth utilization in that district will be 10 (refer Table:5,6 & 7)
In district “Y” there are 10 sites which are having
all 2G+3G+4G+TDD technology.
So bandwidth utilization will be sum of all technologies i.e. 50 MHz (refer Table:5,6 & 7).
In district “Y” there may be other different
technology sites too. Like 2G+4G 32 sites.
But we do not require considering utilization of
district “Y” as 50+35. Instead it would be only 50.
Similar cases for all other combinations too.
Summary:
In telecom network capacity and utilization
calculation is required to do very often.
As technology changes i.e. upgraded from 2G to 3G or
4G or may be site is loaded with TDD whole calculation for a particular site
will be changed.
So this is an ongoing and necessary process to have an overall idea of the whole network.
Thanks for reading this blog.
Your feedback, comments, suggestions or like are highly appreciated.