Any command for 2G, related to any BSC can be executed only after log in to BSC first.
After log in to BSC we can execute any command in that particular BSC.
To Log in any BSC :
Command: eaw BSC name;
Example: eaw RBSCHK2;
Now let’s see 4 commands which we can use to get details of E1, KLM in a BSC.
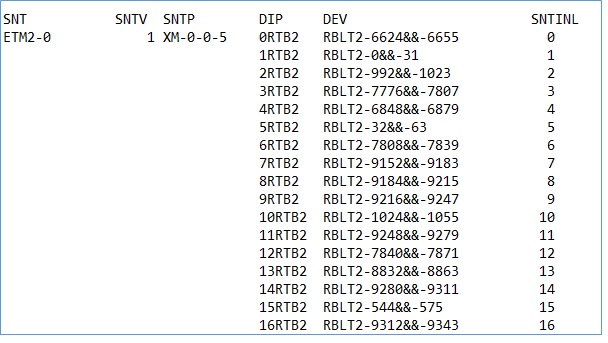
ntcop:snt=all;—————–E1 details/Device detail
The below screen shot is the output of the command ntcop:snt=all; .Through this command we can get STM wise details for each E1. In a single STM there are 63 E1s. Details of each E1 is available through this command. In the below mentioned screen shot ETM2-0 is the STM name. Then against each E1 DIP, Device (DEV) and SNTILN are mentioned. Against each SNTINL we get KLM details, e.g. KLM against SNTINL 1 is 211 and so on.
Likewise details for all available STMs in that same BSC can be extracted by using this ntcop:snt=all; command.
Here in each example, though I am showing only up to 16 E1 but through the command we will get details of all E1s. (for 1 STM 63 E1, and for all STMs available in the BSC)
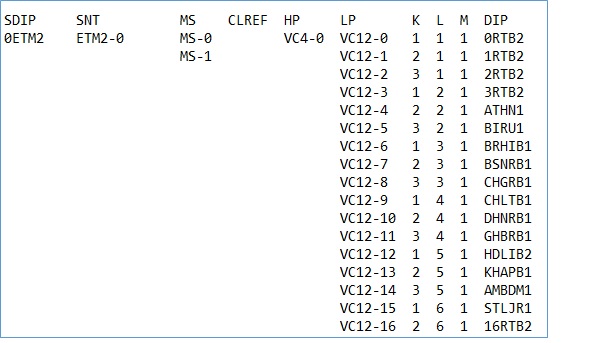
tpcop:sdip=all;——————-SNTINL details
By using tpcop:sdip=all; we can receive below mentioned details. Here also we get STM wise each E1 details for all STMs.
Don’t be confused with the screen shot of above command. Both data are for two different BSCs.
Here KLM actual value is indicated instead of SNTINL number. E.g. VC12-1 has KLM value 211, which represents SNTINL value 1. We don’t get device details through this command.
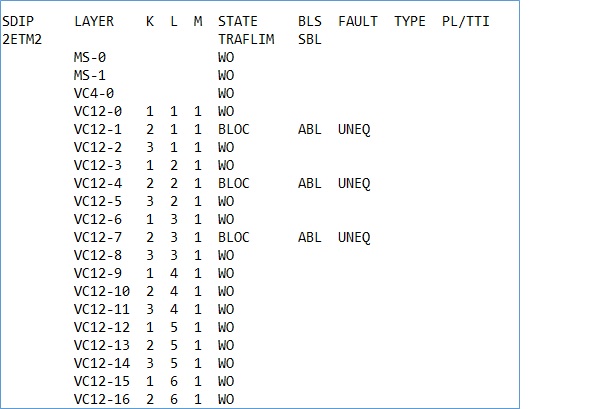
tpstp:sdip=all;—————-E1 status
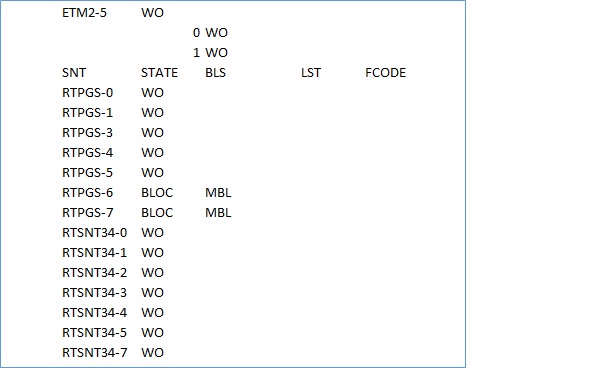
tpstp:sdip=all; gives E1 status. Which E1 is currently busy/used and which are free. It gives details of each E1 KLM number wise for all STMs. If ABL is mentioned against some E1 then we can check those KLMs for free E1. They may not be free and can show ABL if site is down and currently not working.
So before using ABL mentioned E1, we have to check those KLMs properly.
If instead of ABL (Automatic blocked label), if MBL (Manually blocked label) is indicated against any E1/KLM then those E1 are manually blocked and currently free to use.
ntstp:snt=all;——————HW status
SNT wise, E1/KLM is currently used, or free can be seen by using ntstp:snt=all;
If we use above all three commands to get details of all E1s then we can avoid this command. This command will not give you details for all 63E1s of each STMs.
Conclusion:
These commands are useful to check which E1 are free. Free E1 we can use for site migration from one BSC to another BSC. During site migration we require to know free E1 along with DIP, KLM, attached device details and all. For those purpose these 4, especially top 3 commands are very useful.
In Telecom network it is very often required to do the
calculation for the network capacity.
This capacity is mainly required to do an analysis of
the utilization of the network.
What is the current capacity of the network and what
is the status of current utilization of the resources.
In 2G, 3G and 4G (LTE) in all cases we need to find
out capacity of Voice (only for 2G) and Data (Especially for 3G & 4G).
The methods we are going to discuss can be used to do
the calculation before implementation of a network or in existing network.
Here we emphasise mainly to do the capacity calculation for an existing network.
1. Voice Capacity Calculation (2G Network):
Voice
capacity calculation of a site is an old method and most of us are already know
it.
Here
what we do, we do the capacity calculation sector wise, and then add up the
sector values to get site wise total erlang capacity.
Now
take the formula to do the calculation.
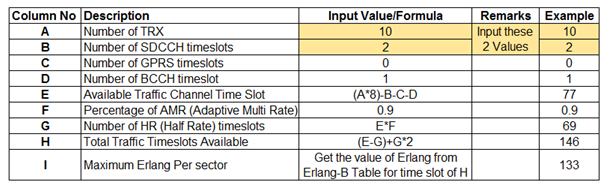
Formula for 1 Sector:
This is a calculation for 1 sector. The column names
mentioned in the table to simplify the formula.
This is a calculation considering HALF RATE (HR) and with Adaptive Multi Rate (AMR).
If we work for FULL
RATE (FR) then we can ignore the columns F, G and H.
Get the Erlang value w.r.t. the timeslot in column E
from Erlang-B table.
Calculation
for the whole Network:
If we have 5000 2G sites in our Network (Just taking a
random example) then we have to sum up the erlang values of all the sectors.
That will become the complete Erlang
(Voice) Capacity or Equipped
Erlang of the network.
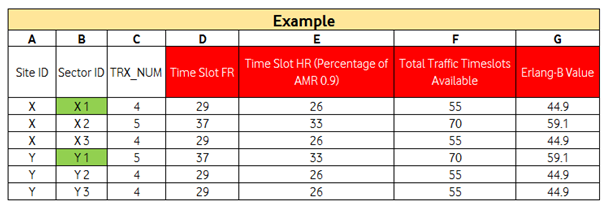
Table: 1
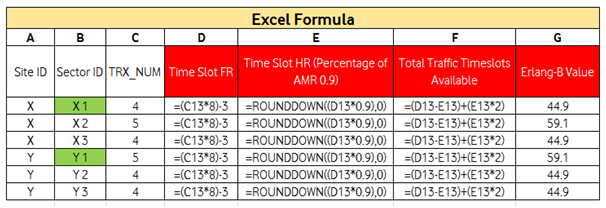
Table: 2
This
is an example of 2 sites each with 3 sectors. Likewise we can do the
calculation for all the sectors of the network and finally sum up the column
“G”. That will become the Erlang
Capacity, Voice Capacity or Equipped
Erlang of the existing network.
After
getting this Capacity now it is easy to find out utilization of sites. We need
to take the traffic data (Cell wise/Site wise) from system generated data and
just divide Traffic by Capacity.
There
is a report which gives Voice and
data capacity of the network.
But sometimes the problem with the report is that, if in any case there are some sites which are down/hold due to some technical /Non-technical issue, capacity of those sites are not considered in the report.
2.Data Capacity Calculation (3G& LTE Network):
Data capacity of a site mainly depends on the
available Bandwidth of the site.
Based on available Bandwidth below is the table which
shows the maximum capacity of a site.
This value may change slightly case to case basis, but
we consider these values as maximum capacity of a site for any calculation
purpose.
Table: 3
Now we can see the below mentioned 6 sites.
Based on site wise technology and bandwidth we will
get a total data capacity of a site.
This total data capacity of the whole network can be
summed up to get the Data Capacity for the whole network, which may contains
any no of sites.
This bandwidth wise data capacity is independent of
frequency band.
For 10 MHz band we will get same 150 GB/site/day for
1800 band or 2100 band 4G sites.
Similar scenario for all other cases too.
Table: 4
Here we are not considering any data for 2G is because
2G data capacity is very low and it is based on the allocation of time slots
for EDGE.
Moreover here we should not confused between data speed
and data capacity. Here we are discussing only about data capacity of a site
not anything about data speed or throughput.
Speed/Throughput altogether is a different concept and
we may discuss in a separate blog.
Utilization:
Again for utilization as we did for 2G traffic. Here
we have to find the actual site wise used payload and divide this value with
the total data capacity.
This may be done site wise or for the whole network.
Here we are considering any telecom circle having the
below mentioned frequency band along with allocated bandwidth.
These figures we are taking just as an example.
Frequency band and allocated bandwidth may vary based
on telecom circle.
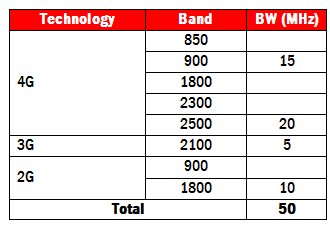
Table: 5
From the above table it is found that for a telecom
circle “X” we have total 50MHz bandwidth.
In 4G total
35 MHz (900 band 15 MHz and 2500-TDD band 20 MHz).
Similarly for 3G
in 2100 MHz band 5 MHz, and for 2G
total 10 MHz in 1800 MHz band.
In this case for calculating site wise bandwidth first
of all we have to find out site wise technology.
In a single site there may be any combination of
technology.
For example we are considering the below mentioned
technology combinations in any site and corresponding site bandwidth.
Table: 6
These technology combinations in a site may vary as
per requirement.
Calculation
for the whole Network (Data & Bandwidth)
In this way we can find site wise total bandwidth.
Once we get site wise data
and bandwidth now we can do all types of permutation combination.
Like District wise, state wise, town wise requirement
of data for capacity and Utilization calculation.
Showing of Bandwidth utilization is bit different from
all other cases. Suppose we need district wise or town wise or may be any
category wise Bandwidth utilization. In that case we can’t do the same
calculation as like voice and data.
Please check the below mentioned table:
Table:7
If in a district named “X” has only 2G sites (here in this example showing 2G sites) then bandwidth utilization in that district will be 10 (refer Table:5,6 & 7)
In district “Y” there are 10 sites which are having
all 2G+3G+4G+TDD technology.
So bandwidth utilization will be sum of all technologies i.e. 50 MHz (refer Table:5,6 & 7).
In district “Y” there may be other different
technology sites too. Like 2G+4G 32 sites.
But we do not require considering utilization of
district “Y” as 50+35. Instead it would be only 50.
Similar cases for all other combinations too.
Summary:
In telecom network capacity and utilization
calculation is required to do very often.
As technology changes i.e. upgraded from 2G to 3G or
4G or may be site is loaded with TDD whole calculation for a particular site
will be changed.
So this is an ongoing and necessary process to have an overall idea of the whole network.
Thanks for reading this blog.
Your feedback, comments, suggestions or like are highly appreciated.