Author: Pranab Hazarika

  • Types of Internet of Things (IoT)

    Types of Internet of Things (IoT)

    The main objective of Internet of Things (IoT) is

    • To globally connect smart ‘things’ or ‘objects’.
    • Objects are uniquely identified.
    • Interoperability among the objects.

    These concepts are well explained in ‘Introduction to Internet of Things.

    Internet of things (IoT) is categorized in 3 segments:

    1. Industrial IoT  (IIOT)
    2. Consumer IoT (CIOT)
    3. Enterprise IoT (EIOT).

    In 5G Americas white paper 5G-The future of IOT it is mentioning that types of IoT use cases is not so much based upon the ‘who’ or ‘where’ but the requirements for the technology implemented.

    This means the segmentation is not based upon what are the equipment, devices used in the system.

    Same sensors, same actuators, and all other devices may be same in all 3 cases.

    The devices used in home, in office, in a factory have the same functionalities.

    But segmentation is done based on requirement of features of IoT connectivity in each sectors.

    Mainly these 3 categories are done based on the below requirements:

    • Security
    • Interoperability
    • Scalability
    • Precision and Accuracy
    • Programmability
    • Low Latency
    • Reliability
    • Resiliency
    • Automation
    • Serviceability
    • Data volume
    • Data throughput

    Some of these characteristics we have discussed in Introduction to Internet of Things (IoT).

    Security is a major concern in all three categories.

    In some scenario we may require very low latency and low data throughput. In some other cases we may compromise latency up to some level, but data uses or requirement of data throughput is very high.

    Get YOUR Copy HERE.

    1.Industrial Internet of Things (IIoT):

    The industrial Internet of Things (IIot) is an application of IoT in industries to modify the various existing industrial systems.IIoT links the automation system with enterprise, planning and product life cycle.

    IIoT includes major industries like:

    • Oil and Gas,
    • Transportation,
    • Manufacturing,
    • Healthcare and Energy.

    Accenture forecast that the Industrial IoT will reach $123 billion in 2021, attaining a CAGR of 7.3 percent through 2020(Ibid). Accenture also forecast that IIoT can add as much as $14.2 trillion to the global economy by 2030 (Ibid)

    Component of IIoT:

    Some integral component of Industrial IoT (IIoT) are

    • Machine Learning
    • Big data technology
    • Machine to Machine interaction (M2M)
    • Automation

    Machine Learning-

    Learning from the existing data and trying to make things predictive and trying to have things which are better in the future, based on current available data.

    Big data technology- 

    Big data means very big is size which ca not be processed with usual tools.

    Big data is mainly based on 3 Vs. Those are

    V- Volume of data: e.g. 500 TB per day (like in Facebook).

    V- Velocity of data: e.g. trying to handle many requests per seconds (like in Google)

    V-Variety of data: e.g. Problem at hand and data we will process are complex.

    Machine to Machine interaction (M2M)& Automation-

    Two or more machines directly interact with one another to complete some purpose or task without any human interventions.

    Thus make the things possible to work in automation.

    Industrial IoT (IIoT) and Industry 4.0:

    The scope of Industry IoT (IIoT) borrows some features of IoT and borrows some features from vision of Industry 4.0.

    Industry 4.0 is basically a framework for:

    • Automation and data exchange in manufacturing technologies.
    • Cyber-physical systems, Internet of things and cloud computing.
    • Smart factory.

    2.Enterprise IoT (EIoT):

    The ultimate need for enterprise to drive IoT is to enhance:

    • Operational efficiency,
    • Mitigate risk,
    • Improve functional visibility,
    • Ensure maximum customer engagement,
    • Increases revenue streams,
    • And tap into potential opportunities for growth.

    For connectivity purpose-

    The 5G network is capable of supporting massive devices and new services, for example

    • Enhanced Mobile Broadband (eMBB),
    • Massive Machine type communication (mMTC),
    • Critical communications and network operations

    compared to 4G-LTE network.

    5G mobile system for Enterprise IoT is trusted to provide low latency, high versatility and high throughput for large number of gadgets

    Use cases:

    Enterprise IoT would have the greatest impact in

    • Service Operations
    • Manufacturing.

    These two broad groups can be further distributed into:

    • Supply Chain
    • Research & Development (R&D)
    • Marketing and Sales
    • And small segment of other parts of enterprise.

    For example, manufacturing machines at the manufacturing floors are integrated with

    • Enterprise resource planning (ERP),
    • Customer relationship management (CRM),
    • Supply chain management (SCM),
    • And knowledge management (KM) applications in order to ensure utmost automation.

    The results and outputs are simply the aggregated ones. Any event information gets instantaneously captured and processed in order to activate appropriate systems in time.

    Any slight delay may lead to destruction. The much needed integration gets fulfilled through a host of integrators, connectors, drivers, and adaptors.

    Key Drivers for Enterprise IoT:

    The Enterprise IoT (EIoT) is relatively new development in the IoT sector.

    Key drivers of Enterprise IoT (EIoT) are, but not limited to:

    • Infrastructure optimization
    • Process excellence
    • Architecture assimilation
    • Technology adaption and adoption
    • Leverage data (internal as well as external) toward actionable insights

    3.Consumer IoT (CIoT):

    The IoT is changing how consumers interact with consumer electronics, enabling greater convenience for a better experience, access to data that enables them to optimize their usage, and increasing control they have over their devices.

    With IoT, the world is at our fingertips.

    Wearables,gadgets and gizmos, portables, implantable, handhelds, consoles, appliances, instruments, and utensils are the fast-emerging and evolving IoT products.

    The number of connected devices in the hands of people in our everyday works and walks are drastically increasing.

    Use cases:

    • Fitness tracker,
    • Smart home thermostat,
    • Wi-Fi connected camera,
    • Virtual reality headset,
    • smart refrigerator and toaster,
    • Alarm panel
    • Smart glasses.

    The connection between all of them is that they are often controlled by apps.

    Growth of Consumer IoT (CIoT):

    Consumer IoT is no more in the study state. These are already in our used cases and it is very fast growing sector of IoT.

    For example, as per Statista The North America IoT consumer electronics market is predicted to increase from $90B in 2017 to $180B in 2022, attaining a CAGR of 12.25 percent.

    Summary:

    In this article we just touched all the categories of Internet of Things (IoT) to give a brief idea.

    We will go deep in to all segments in upcoming blogs.

    Thanks for reading this blog.

    Your feedback, comments, suggestions or like are highly appreciated.

    Ref:

    5G Americas: 5G-The Future of IoT

    The Internet of Things- by Pethuru Raj &Anupama C. Raman

    Introduction to IoT- by Dr. Sudip Misra

    Get YOUR Copy HERE.

    Pranab Hazarika

    BE | MBA | PMP | IoT-Certified

    www.PranabHazarika.com

  • Transmission Microwave Backhaul Optimization in Telecom Network
    Transmission Microwave Backhaul Optimization in Telecom Network
    In telecom network Transmission backhaul is the main Backbone of the network.
    Whatever technology we may use 2G, 3G, LTE or even 5G the main support provided by transmission network only and desired data speed can only be obtained if we have sufficient available bandwidth in transmission links.

    These transmission links may be:

    1. Microwave
    2. Fibre
    3. VSAT
    4. Or any other medium.

    In telecom network first three types of transmission medium is mainly used.

    VSAT is only used in cases where the target location is very remote and Line of Sight (LOS) is not cleared anyhow.

    Additionally installation as well as maintenance cost of VSAT is very high. And available bandwidth is low. So expected bandwidth are usually 512 Kbps or somewhat nearby.

    So main transmission medium till 3G network was only Microwave though fibre was preferred for redundancy, path protection and main backhaul connectivity.

    When 4G came, fibre become a part and parcel of the network as to get desired data speed of 4G. We need huge bandwidth to support 4G speed.

    In 4G it is a combination of Fibre as well as Microwave connectivity.

    When 5G will come up as a normal service fibre will play the main role of connectivity.

    Transmission Bandwidth Requirement:

    Per site bandwidth requirement based on technology wise and spectrum wise are as below:

    TDD & MM coexistence site:

    For a site where TDD and MM (Massive MIMO) both are present then bandwidth of MM is considered as the bandwidth of the site.

    TDD bandwidth for that particular site is not added to the MM bandwidth.

    More than 1 sector MM site:

    For more than 1 sector MM (Massive MIMO) site, total bandwidth of the site is considered as:

    Site BW= MM Bandwidth of 1 sector * 1.5

    We can take the below examples:

    Let’s take 20 MHz bandwidth scenario for both MM and TDD

    Site with 1 MM sector + 2 TDD sectors:

    Site bandwidth will be 200 Mbps.

    Site with 2 MM sectors+ 1 TDD sector:

    Site bandwidth will be 300 Mbps.

    i.e 200 Mbps of 1 sector of the MM * 1.5 times.

    Site with 3 MM sectors:

    Site bandwidth will be 300 Mbps.

    i.e 200 Mbps of 1 sector of the MM * 1.5 times

    Massive MIMO sites required very high backhaul requirement.

    So these sites are ideally planned in fibre pop locations only.

    Here we should not be confused with bandwidth of Radio frequency planning and transmission bandwidth.

    Here we are discussing only about transmission/backhaul bandwidth. About Radio Frequency bandwidth we discussed in “Voice and Data Capacity Calculation of 2G, 3G and LTE Network”.

    Now we can understand that based on backhaul available bandwidth we can expect data speed on our mobile. Speed is also depends on Technology i.e. 3G, 4G or 5G and their modulation scheme.

    If congestion occurs in transmission network, data speed gets reduced.

    These congestion are mainly happens in case of data linked sites i.e. 3G or 4G sites.

    So it is very much required to check and do optimization of the transmission links.

    If utilization of a transmission link goes beyond 70% then we should plan to optimize or upgrade the links.

    There are mainly 3 different methods we can apply to upgrade or optimize a link.

    1. Bandwidth up-gradation
    2. Link re-routing
    3. Link equipment up-gradation.

    Bandwidth up-gradation:

    For IP nodes we can upgrade the available bandwidth of the microwave links.

    Suppose a link is working on available bandwidth of 183 Mbps then we can upgrade it to 214 or 240 Mbps and check if the link utilization is going down or not.

    If some links are working below 183 Mbps, then we can upgrade those links to 183 Mbps.

    Only problem in upgradation of bandwidth is that with new bandwidth if we run link budget in some cases it may shows loss of availability of the link.

    If this problem occurs then we should not prefer bandwidth upgradation.

    This problem occurs because, with bandwidth increase we have to also increase power.

    If power is already in maximum, then this may give a low receive level at the receiver end.

    Advantageofbandwidth upgradation is that no additional cost involved and less time consuming. If link budget in planning tool works perfect then we can immediately implement the same in the system.

    Link re-route Engineering:

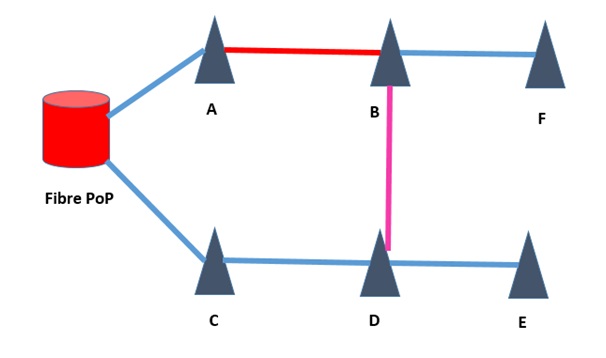
    We take an example of the above figure as a part of our network.

    In the above figure “A” to “F” are Base stations (BTS). Serving route of F is in the direction from Fiber pop up to BTS location “F”. The physical route of serving E1 is “Fibre PoP-A-B-F”.

    Link “A-B”is congested and bandwidth upgradation can’t be done. This link is carried traffic of nodeB (3G)/enodeB(4G)  “B” as well as nodeB(3G)/enodeB(4G) “F”.

    Remaining all other links are not highly utilized.

    So if we reroute path of “F” then congestion level may goes down in the link between “A-B”.

    Here we can make a new route in the direction “Fibre PoP-C-D-B-F”.

    This is a very simple case we are considering here for ease of understanding.

    Main issue in such type of activity is that once we route “F” through new route “Fibre PoP-C-D-B-F” there may be chances that any link of this route may get congested.

    So, for that, before making a new route we have to check each link of the new route whether they are able to handle new traffic of “F” or not.

    If not then there is no meaning of doing of all these rerouting activities and plan for some other alternatives.

    Link equipment up-gradation

    Third option is link equipment upgradation.

    We can replace the MW hop with XPIC (Cross Polarization) hop.

    This will double the capacity of the link.

    If the congested link is already a XPIC hop then we may plan for some new fibre PoP.

    XPIC upgradation and Fibre PoP plan both have cost involvement.

    So this is the last option we choose if all other possibilities failed.

    Summary:

    Once we have noticed any link utilization greater than 70% we plan for any of the three methods that we discussed above.

    Transmission Link should have enough available bandwidth in 3G, 4G and 5G network to get desired data speed.

    Thanks for reading this blog.

    Your feedback, comments, suggestions or like are highly appreciated.

    Pranabjyoti Hazarika

    BE | MBA | PMP | IoT-Certified

  • Introduction to Internet of Things (IoT)

    Introduction to Internet of Things (IoT)

    A formal definition of Internet of Things is as below:

    “”The Internet of Things (IoT) is the network of physical objects that contain embedded technology to communicate and sense or interact with their internal states or the external environment.””

    Now let’s understand Internet of Things in very simple way.

    Till now when we say internet based services we understand connections of different computers and computing devices.

    Now the Internet of Things says that the scope of internet is expanded or going to be expanded beyond computers and computing devices.

    Now whatever “things” we can see, we can touch can be a part of the internet of world.

    They will communicate in between, with humans and so on.

    So in simple terms anything can be connected to the internet world and this is called Internet of Things (IoT).

    IoT is no more in research state and by 2020 it is expected that 50 billion devices will be part of IoT.

    This count will increase gradually as the use of devices, equipment, home appliances are increasing day by day and they are always more than human beings.

    Get your copy here

    Application of Internet of Things (IoT):

    Some applications of Internet of Things in different domains are as below but not limited to:

    • Home: Smart Lighting, Smart Appliances
    • Cities: Smart Parking, Smart Roads
    • Environment: Weather Monitoring, Noise Pollution Monitoring
    • Energy: Smart Grids, Renewable Energy System
    • Retail: Inventory Management, Smart Payments
    • Logistics: Shipment Monitoring, Route Generation
    • Agriculture: Smart Irrigation, Green House Control
    • Industry: Indoor Air Quality Monitoring, Machine Diagnosis
    • Health & Lifestyle: Fitness Monitoring, Wearable Electronics

    Market Drivers of Internet of Things (IoT):

    IoT is a new game changer for businesses and individuals and is considered to be the fourth industrial revolution by experts and scientists.

    The drivers and trends that contribute to the massive growth and development of IoT are as below, but not limited to:

    • 3GPP standards
    • Expanded and low cost internet connectivity
    • Expanded mobile communication
    • Emerging of new mobile technology like LTE and 5G.
    • Low cost sensors
    • Large IoT investments
    • Growing importance of Automation
    • Big data knowledge
    • Artificial Intelligence
    • Machine learning
    • Deep learning
    • Edge computing and cloud
    • Security assistance
    • IPV6 addressing system

    Characteristics:

    Different characteristics of IoT are:

    • Efficient, scalable and associated architecture
    • Unambiguous naming and addressing
    • Abundance of sleeping nodes, mobile nodes.
    • Intermittent connectivity
    • As we already came to know that in IoT billions of, trillions of devices are going to be interconnected so, it must be scalable and as well as efficient too.
    • Identification of each nodes must be unique. Currently IPV4 system is usually used for IP addressing which is having 32 bit addressing scheme.

    For IoT we need to think beyond IPV4 and necessity to go for IPV6. IPV6 is having 128 bit addressing scheme.

    • There should be large number of sleeping nodes in the system.

    Whenever they are not being used they should be in sleeping mode and as per requirement make them active.

    As there are large no of nodes connected in the network it is not possible to check and change battery or power supply to the nodes very frequently.

    So the battery life of the nodes should be very large like many years. To make the battery life long, we should make some arrangement so that all nodes are continuously not active and go to sleep mode when they are not required to be active.

    By this way we can make long battery life of the nodes and thus make them long live.

    • Mobility of the nodes is also a part of IoT network.

    e.g. if a person is wearing a smart watch, along with the person that nodes must also be mobile and should work properly during mobility.

    • Intermittent Connectivity means one device currently connected to a particular device may not be connected to it at a later instance of time and gets connected to some other new device or devices.

    IoT Market Share:

    IoT is attractive in different application domains.

    A study found that currently the IoT market share in different domains are like (Source: Intel)

    Manufacturing/ Business: 40.2%

    Healthcare: 30.3%

    Retail: 8.3%

    Security: 7.7%.

    So we have seen that currently Manufacturing /Business is on the top of the IoT market share.

    It improves overall supply chain management, different sensors, actuators, different robotic machinery can be used to improve the business process.

    In healthcare remote areas can be connected to the different health care facilities of doctors, nurses, and other services whether they are present in front of them or not.

    They will be remotely connected and treated.

    Recordkeeping and access remotely to those reports is also an added advantages to healthcare industry.

    In case of Retail sectors tasks such as inventory tracking, smartphone purchasing, anonymous analytics of consumer choices, these are the different things that can be done efficiently through use of IoT.

    Fingerprint, biometric and facial recognition these technologies can be connected and used with the help of IoT for Security purpose.

    Machine to Machine (M2M) Communications:

    Machine to Machine (M2M) communications was first introduced by Telecommunications service providers (TSP).

    Earlier IoT was referred to as Machine to Machine (M2M) communications only.

    M2M means devices connected to internet can communicate to one another through wired and mostly wireless network.

    From this concept of M2M with evolved communication technology like 4G-LTE or 5G, concept of MASSIVE IoT deployment comes in to picture.

    Along with Massive another part of IoT is CRITICAL IoT.

    Massive IoT:

    Requirements of Massive IoT:

    • Low cost
    • Low energy
    • Small data volumes
    • and Massive numbers of devices.

    Examples are like smart buildings, smart agriculture, logistic tracking and management etc.

    Critical IoT:

    Requirements of CriticalIoT:

    • Ultra-Reliable
    • Very low latency
    • Very high reliability

    Examples are like remote health care, traffic safety and control, industrial applications and control etc.

    M2M expansion is growing in very high speed and Cisco predicting that by 2022 there will be 14.6 billion machine-to machine (M2M) IoT connections.

    IoT Vs M2M:

    M2M refers to the communications between machines and devices.

    Internet of Things (IoT) is a wider concept and M2M is a part of IoT, reverse is not.

    Expectation of IoT:

    Applications of IoT can be expected in almost every sphere of society and any sphere of life.

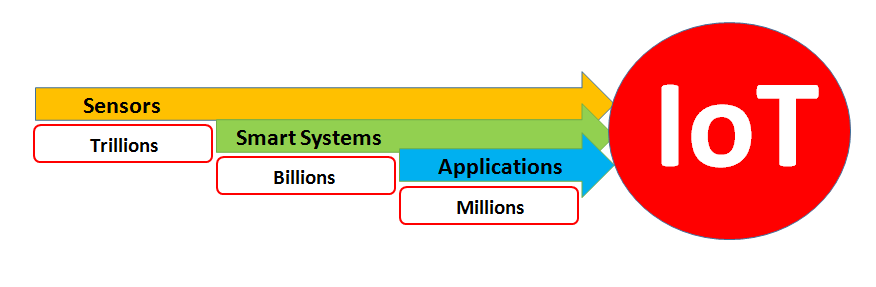
    It is expected to have trillions of sensors (nodes), billions of smart systems and millions of applications are going to be internetworked.

    Summary:

    This is just a beginning of the Internet of Things (IoT) chapter.

    In upcoming blogs we will go deep in to the concepts, theory, devices and applications of IoT in details.

    Thanks for reading this blog.

    Your feedback, comments, suggestions or like are highly appreciated.

    Ref: Internet of Things, A Hands-on approach by Arshdeep Bahga& Vijay Madiset

    5G the future of IoT, 5G Americas

    Internet of Things: Dr. Sudip Misra

    Get your copy here
    Get your copy here

    Pranab Hazarika

    BE | MBA | PMP | IoT-Certified

  • Voice, Data and Bandwidth Capacity Calculation of 2G, 3G & LTE Mobile Communication Network

    Voice, Data and Bandwidth Capacity Calculation of 2G, 3G & LTE Mobile Communication Network

    In Telecom network it is very often required to do the calculation for the network capacity.

    This capacity is mainly required to do an analysis of the utilization of the network.

    What is the current capacity of the network and what is the status of current utilization of the resources.

    In 2G, 3G and 4G (LTE) in all cases we need to find out capacity of Voice (only for 2G) and Data (Especially for 3G & 4G).

    The methods we are going to discuss can be used to do the calculation before implementation of a network or in existing network.

    Here we emphasise mainly to do the capacity calculation for an existing network.

    1. Voice Capacity Calculation (2G Network):

    Voice capacity calculation of a site is an old method and most of us are already know it.

    Here what we do, we do the capacity calculation sector wise, and then add up the sector values to get site wise total erlang capacity.

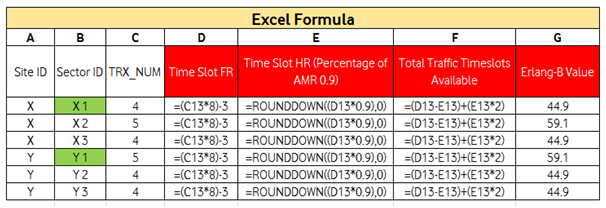
    Now take the formula to do the calculation.

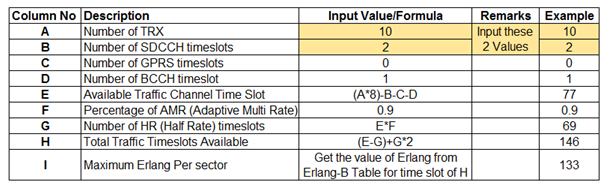
    Formula for 1 Sector:

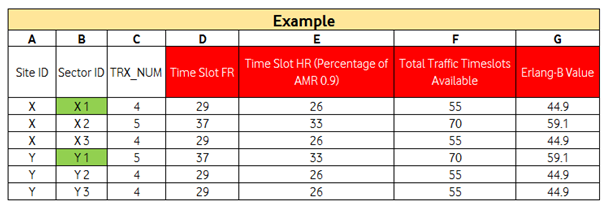
    This is a calculation for 1 sector. The column names mentioned in the table to simplify the formula.

    This is a calculation considering HALF RATE (HR) and with Adaptive Multi Rate (AMR).

    If we work for FULL RATE (FR) then we can ignore the columns F, G and H.

    Get the Erlang value w.r.t. the timeslot in column E from Erlang-B table.

    Calculation for the whole Network:

    If we have 5000 2G sites in our Network (Just taking a random example) then we have to sum up the erlang values of all the sectors. That will become the complete Erlang (Voice) Capacity or Equipped Erlang of the network.

    Table: 1

    Table: 2

    This is an example of 2 sites each with 3 sectors. Likewise we can do the calculation for all the sectors of the network and finally sum up the column “G”. That will become the Erlang Capacity, Voice Capacity or Equipped Erlang of the existing network.

    After getting this Capacity now it is easy to find out utilization of sites. We need to take the traffic data (Cell wise/Site wise) from system generated data and just divide Traffic by Capacity.

    There is a report which gives Voice and data capacity of the network.

    But sometimes the problem with the report is that, if in any case there are some sites which are down/hold due to some technical /Non-technical issue, capacity of those sites are not considered in the report.

    2.Data Capacity Calculation (3G& LTE Network):

    Data capacity of a site mainly depends on the available Bandwidth of the site.

    Based on available Bandwidth below is the table which shows the maximum capacity of a site.

    This value may change slightly case to case basis, but we consider these values as maximum capacity of a site for any calculation purpose.

    Table: 3

    Now we can see the below mentioned 6 sites.

    Based on site wise technology and bandwidth we will get a total data capacity of a site.

    This total data capacity of the whole network can be summed up to get the Data Capacity for the whole network, which may contains any no of sites.

    This bandwidth wise data capacity is independent of frequency band.

    For 10 MHz band we will get same 150 GB/site/day for 1800 band or 2100 band 4G sites.

    Similar scenario for all other cases too.

    Table: 4

    Here we are not considering any data for 2G is because 2G data capacity is very low and it is based on the allocation of time slots for EDGE.

    Moreover here we should not confused between data speed and data capacity. Here we are discussing only about data capacity of a site not anything about data speed or throughput.

    Speed/Throughput altogether is a different concept and we may discuss in a separate blog.

    Utilization:

    Again for utilization as we did for 2G traffic. Here we have to find the actual site wise used payload and divide this value with the total data capacity.

    This may be done site wise or for the whole network.

    3.Bandwidth Capacity Calculation (2G,3G & LTE Network):

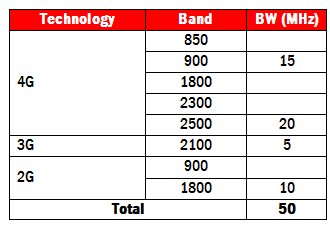
    Here we are considering any telecom circle having the below mentioned frequency band along with allocated bandwidth.

    These figures we are taking just as an example.

    Frequency band and allocated bandwidth may vary based on telecom circle.

    Table: 5

    From the above table it is found that for a telecom circle “X” we have total 50MHz bandwidth.

    In 4G total 35 MHz (900 band 15 MHz and 2500-TDD band 20 MHz).

    Similarly for 3G in 2100 MHz band 5 MHz, and for 2G total 10 MHz in 1800 MHz band.

    In this case for calculating site wise bandwidth first of all we have to find out site wise technology.

    In a single site there may be any combination of technology.

    For example we are considering the below mentioned technology combinations in any site and corresponding site bandwidth.

    Table: 6

    These technology combinations in a site may vary as per requirement.

    Calculation for the whole Network (Data & Bandwidth)

    In this way we can find site wise total bandwidth.

    Once we get site wise data and bandwidth now we can do all types of permutation combination.

    Like District wise, state wise, town wise requirement of data for capacity and Utilization calculation.

    Showing of Bandwidth utilization is bit different from all other cases. Suppose we need district wise or town wise or may be any category wise Bandwidth utilization. In that case we can’t do the same calculation as like voice and data.

    Please check the below mentioned table:

    Table:7

    If in a district named “X” has only 2G sites (here in this example showing 2G sites) then bandwidth utilization in that district will be 10 (refer Table:5,6 & 7)

    In district “Y” there are 10 sites which are having all 2G+3G+4G+TDD technology.

    So bandwidth utilization will be sum of all technologies i.e. 50 MHz (refer Table:5,6 & 7).

    In district “Y” there may be other different technology sites too. Like 2G+4G 32 sites.

    But we do not require considering utilization of district “Y” as 50+35. Instead it would be only 50.

    Similar cases for all other combinations too.

    Summary:

    In telecom network capacity and utilization calculation is required to do very often.

    As technology changes i.e. upgraded from 2G to 3G or 4G or may be site is loaded with TDD whole calculation for a particular site will be changed.

    So this is an ongoing and necessary process to have an overall idea of the whole network.

    Thanks for reading this blog.

    Your feedback, comments, suggestions or like are highly appreciated.

    Pranabjyoti Hazarika

    BE | MBA | PMP | IoT-Certified

  • Different types of Cell Site in Telecom

    Different types of Cell Site in Telecom

    Coverage, Infill, Capacity, In-building Solution, Small Cell, Femto Cell and Repeater

    Today we are going to discuss about different types of Cell site in telecom field.

    These cell sites can be used in 2G, 3G, 4G or 5G technologies.

    There are seven types of cell site or solution we can have to provide network coverage and capacity.

    They are:

    1. Coverage site.
    2. Infill Site.
    3. Capacity Site.
    4. Samll Cell.
    5. Femto Cell.
    6. In-Building Solution (IBS)
    7. Repeater.

    Out of all these, we know most of the things about coverage, Infill and capacity sites and repeater.

    But Small cell, Femto cell are some new concept those are coming along with 4G and 5G technology.

    1.Coverage / New Site

    A location where Operator-A does not have any coverage and planning to expand its coverage in that particular location then this type of site/sites are called Coverage site.

    In that particular area customers will get Operator-A network for the 1st time.

    The coverage distance of a capacity site is as much as possible so that it can cover maximum distance.

    Basic Planning Part of Coverage Site:

    1800 MHz Band:

    Usually coverage sites are planned based on frequency band.

    If we are using 1800MHz band then in ideal condition 1800MHz site can give coverage up to 2.5Km.

    So we prefer a site which is not coming within 2 to 2.5 Km rang of an existing site.

    This concept is not always applicable especially in case of Dense Urban, Urban, and Semi-Urban area.

    Because in such kind of area due to high rise and congested buildings indoor coverage issue is always seen.

    So in such type of area we may plan coverage sites for the first time within 1 Km or even 500m or may be less based on clutter density and terrain conditions.

    900 MHz Band:

    In case of 900 MHz the coverage range of a site may goes up to 4 Km.

    So in that case we should not prefer a new site below 3.5 Km from an existing site.

    Highway:

    On highway sites the distance between the sites are kept at a greater distance than normal sites, as at highway sites we generally use comparatively high gain antenna than normal sites.

    High gain antenna gives a long distance coverage e.g. like 4 Km gap for 1800 MHz band.

    2.Infill Site:

    In a location, suppose a in a town name X, Operator-A already has coverage either with one site or may be 2, 3 or more sites (for bigger town).

    But inside the town or location there are some places where there is some coverage gap or black holes of coverage and the existing sites are unable to provide proper coverage in those particular locations.

    In such cases we plan new site specially to remove coverage gap inside a town or a location.

    These sites are called Infill site.

    Infill sites are planned to cover a distance up to 500-700m or may be up to 1Km based on coverage gap and the location where we want to provide network coverage.

    Coverage distance of infill sites is totally based on the area where we want to mitigate the coverage gap.

    For a dense city with hilly terrain we may plan a new infill site even at a distance of 100m from exiting tower. But for a same kind of dense city with plain terrain we may prefer a new site beyond 300-500m from existing site.

    In case of Infill site, site optimization is done properly so that we should not face the problem of interference of nearby site as well as coverage overlapping.

    3.Capacity Site:

    Suppose in a location there are 3, 4 sites or any no of sites and provide good coverage in the whole town.

    There is no coverage gap in any place. But sites are over loaded. All or may be one,two sites or may be 2, 3 sectors of the town are highly congested and we can’t add any more capacity to that site.

    In such scenario we plan some new sites to off load the congested cells.

    This type of site is called Capacity Site.

    Basic Planning Part of Capacity Site:

    2G:

    Earlier when we have only 2G technology and if traffic for a particular site increasing day by day and equipped capacity of that sites is more than 160% utilized then we planned for TRX addition.

    If TRX addition reached to a level of exhaustion based on the BTS capacity then we plan for a new site nearby to offload 1 or 2 sectors of that site.

    TRX handling capacity is depends on the type of BTS we are using.

    Suppose if we use a Nokia ULTRA BTS (which is obsolete now a days) then it can handle only 12 TRX (4/4/4). If we want to increase TRX capacity at a ULTRA BTS site then we need to install 1 more BTS box to support additional TRXs.

    If we use Nokia BTS like Flexi Edge then additional hardware not required, only software upgradation required.

    But whatever the upgradation capacity (TRX capacity) of a BTS, it also depends on the available bandwidth of 2G.

    3G & 4G:

    4G VoLTE (voice over LTE) is totally based on packet switched concept i.e. only data. No circuit switching.

    In case of 3G, though voice traffic is handled by circuit switching, still as 3G is going to become obsolete very soon operator are not much concern about increasing 3G capacity at site.

    Gradually 3G layers will be converted to 4G layer on the same frequency band.

    Equipment for 3G and 4G will be almost same except we have to replace the 3G baseband (a card inside the BTS) with a new 4G baseband.

    No need to replace antenna and Radio unit. But sometimes based on the 4G compatibility of Radio unit (RRU) we may need to replace the existing 3G RRU with new 4G RRU.

    But this is not applicable for all cases.

    How to convert a 3G layer to a 4G layer in same frequency band of 3G we will discussed in my upcoming blog in details.

    Alternate Options of Capacity Site:

    Now a days we avoid to implement or integrate capacity sites.

    Currently the main concern is with data rather than voice traffic. As we have now 3G and 4G both technologies over and above 2G.

    In Case of 4G we don’t prefer a capacity site to offload one or 2 sectors of an existing 4G site.

    In 4G we have so many alternate options.

    If payload of a site increases we can take any of the below mentioned steps.

    Option 1- Bandwidth Expansion:

    Considering existing 4G site is operating at 1800MHz band FDD and in 5MHz.

    Then we can upgrade it to

    1. 10 MHz band
    2. 15 MHz band
    3. 20 MHz band

    And even beyond 20MHz also provided the operator has a continuous frequency band of 20MHz or beyond.

    For that we need to take only software licenses. No need to do any changes in hardware part.

    Option 2- TDD Site:

    Going for a TDD (Time Division Duplexing) site at the same location.

    If we have 2500 MHz or 2300 MHz TDD frequency band then we add equipment of the respective band at the same sites.

    Equipment will include Antenna, Radio and baseband unit.

    Addition of TDD layer will increase the data handling capacity of that site.

    Even in TDD also we have options to increase our bandwidth of sites, suppose from 10MHz to 20 MHz, based on availability of frequency band of the Operator.

    Putting a new technology like TDD on existing FDD site or bandwidth expansion is cheaper compared to installation of a new site.

    Option 3- Small Cell:

    And the last option for increasing the capacity of a 4G or 5G site is Small Cell.

    So now a days capacity site planning is not preferred until and unless all above mentioned attempts fail to handle the carried traffic/payload of the site.

    4.In-Building Solution (IBS)

    In Building Solution (IBS) is to provide coverage inside a building and in each floor.

    Here there is a MACO BTS like any other normal site. We can use 1 or 2 sectors as Outdoor site as normal site and 1 sector can be used only for Indoor coverage purpose.

    That sector will serve lots of small indoor antennas in each floor.

    In some cases we don’t use any outdoor sector to provide coverage outside the building.

    This type of site is installed in big hotels or large complex.

    In all above discussed cases, we use MACRO BTSs.

    Now we come to discussion of all new kind of BTSs or solutions based on different requirement.

    The new cell concept that now we are going to discuss is about Samll Cell, Femto Cell and Repeater are some solutions for the coverage and capacity requirements for the hotspot locations, enterprise accounts and high values subscribers.

    5.Small Cell:

    There are broadly three types of solutions namely

    1. Outdoor Small Cell
    2. Residential Small Cell.
    3.  Enterprise Small Cell.

    Here we are discussing only about types of small cell. We will discuss in details about small cell in a separate blog.

    Outdoor Small Cells:

    To meet coverage and capacity requirements at Hot spot or small area coverage requirement, outdoor small cell is solution for such requirement. It is IP65 and consumes low power. The unit can be mounted on walls, poles or masts. This is all in one (AiO) solution need AC power supply and backhaul connectivity to integrate.

    In 5G only small cell concept is used. Its coverage distance is 50 to 100m. So lot of cell site will be required if we plan to provide 5G in a particular area.

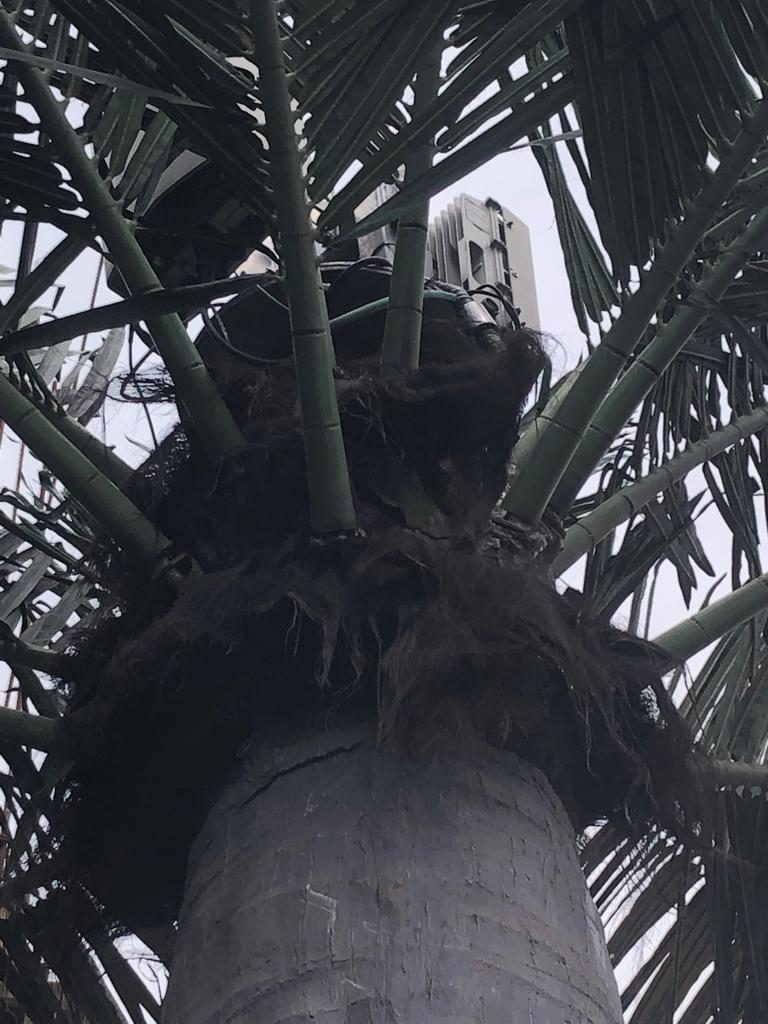
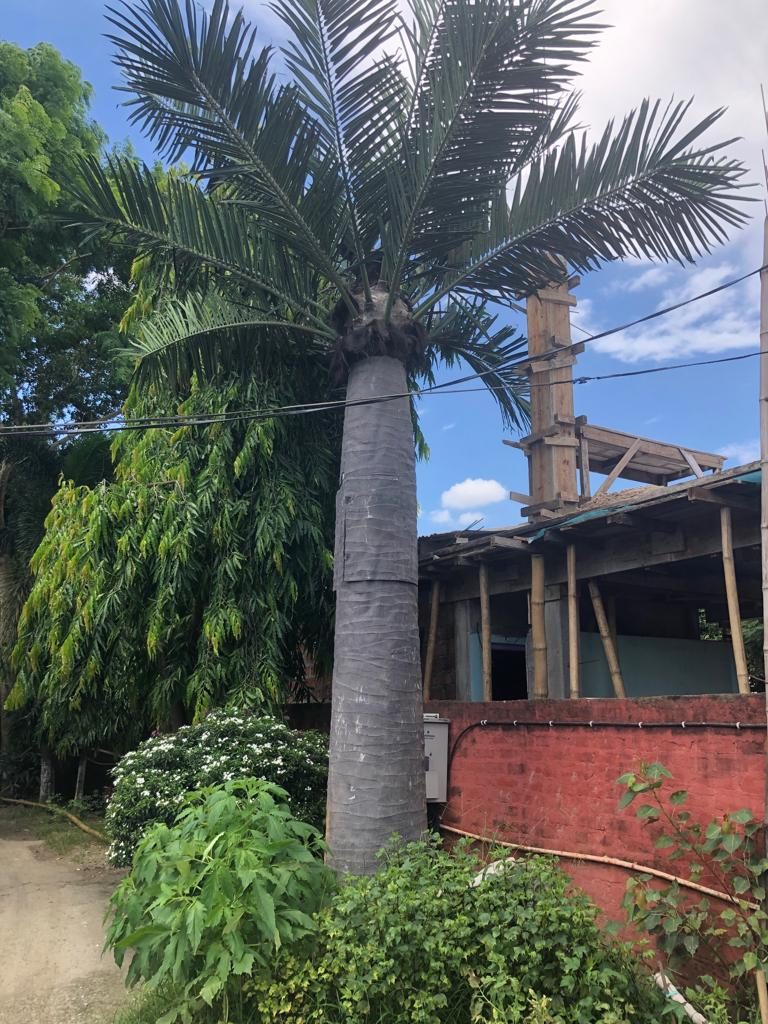
    Camouflage Outdoor Small Cell

    Below is the example of a camouflaged outdoor small cell.

    It was installed in a restaurant with garden outside. In that garden this small cell was camouflaged like a coconut tree.

    Residential Small Cells:

    Residential indoor small cells solution is for hot spots as the complementary coverage and capacity solution. It can be used in Small Office Home Office (SOHO), SME (Small and Medium Enterprise), government offices, stations, entertainment places, hotels and airports etc.

    It is a small and light all-in-one system which integrated baseband and radio modules. It can be flexibly installed in many places such as on the desk, on the wall or under the ceiling. It

    Aims to provide ultra-high-speed data services especially for hot spots or poor/no coverage area as a supplemental of macro base station. This is also all in one (AiO) solution need AC/DC power supply and backhaul connectivity to integrate.

    This type of small cell we usually plan to give better coverage and capacity at the Stores owned by the Operator itself.

    Enterprise Small Cells:

    To full fill unprecedented amount of mobile broadband capacity inside buildings enterprise small cell is the solution. This is the solution to multiflorous commercial building.

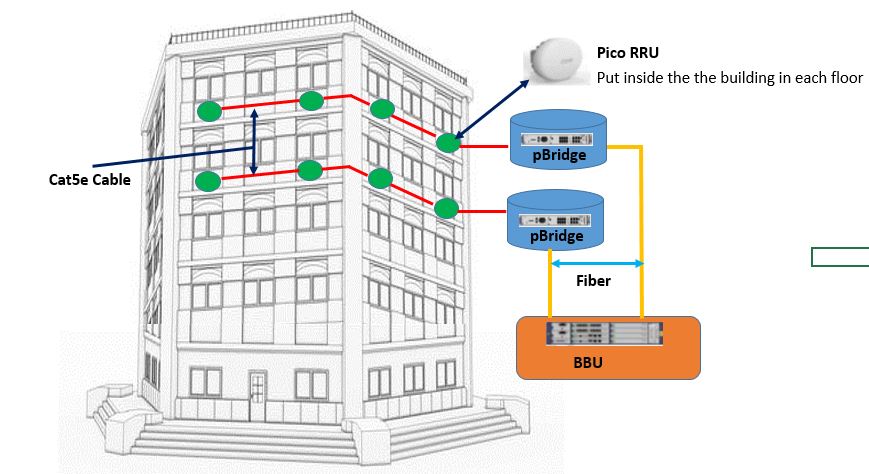
    It involves floor wise planning and deployment of radios with hub devise and baseband. Enterprise small cells can be used at retail stores, branch offices, corporate headquarters and university campuses etc.

    6.Femto Cells:

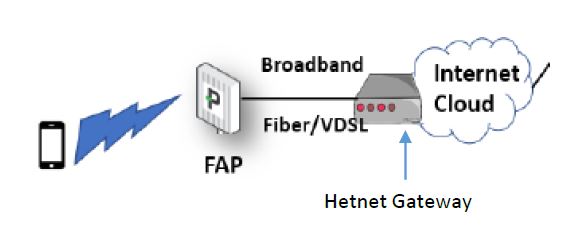
    Femto solution is similar to small cell indoor solution, suitable for residential, enterprise deployments. It provides backhaul flexibility from traditional Optical or Ethernet to any IP public or private backhaul and make this solution easy to deploy.

    Apart from backhaul Hetnet gateway also required which is for security and IPsec tunnelling purpose.

    7.Digital Repeaters:

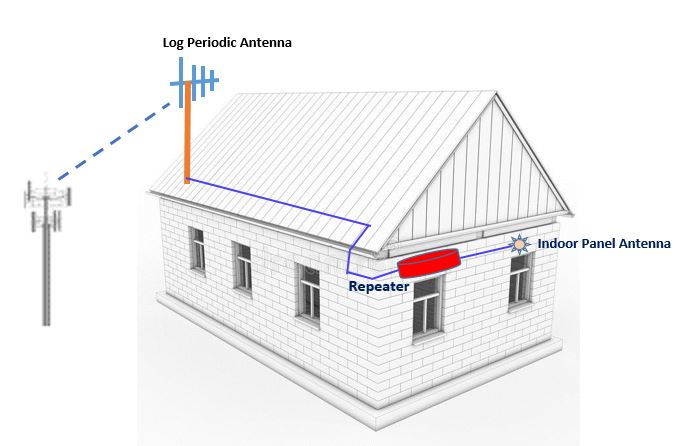
    Digital repeaters amplify weak signal and provide coverage in deep indoor or poor signal areas, these devices can be used to provide coverage in indoor residential building or small commercial buildings or specific floor of multistory building.

    Digital repeaters do not actively involve radio devices to generate signals, these repeaters are also knows as signal boosters. Outdoor repeaters are also available in high power range.

    These devices boosts specific band signal and assigned sub bands. These are coverage solution and do not contribute in capacity.

    Pranabjyoti Hazarika

    BE | MBA | PMP|IoT-Certified

  • Massive MIMO

    Massive MIMO

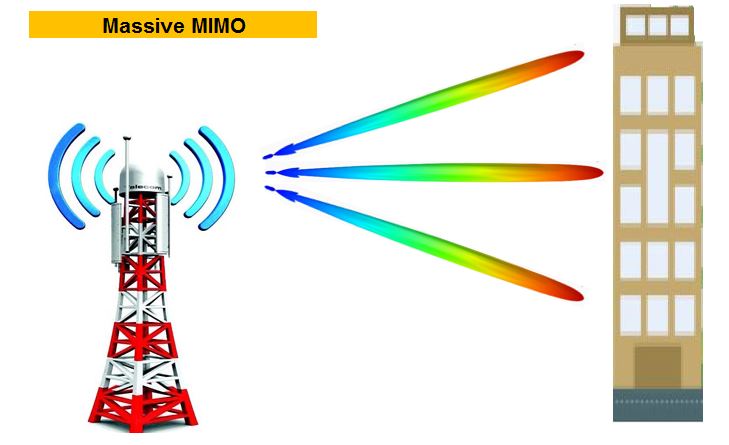
    Massive MIMO is a key update of multiple-antenna technology.

    It uses large no of antenna arrays.

    Performs 3D beamforming and multi-user multiplexing.

    Significantly improves system capacity.

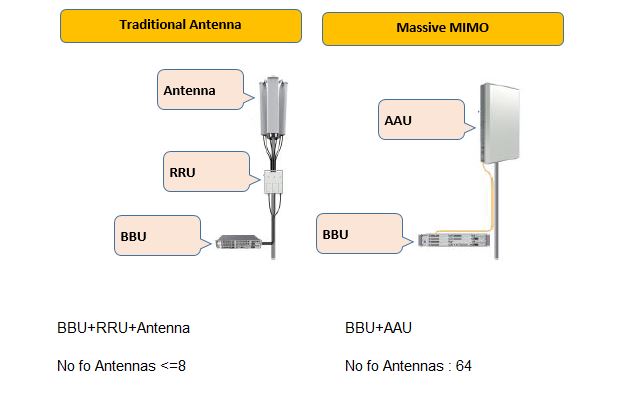
    In Massive MIMO an antenna Module named AAU is used.

    AAU is Active Antenna Unit that has both Antenna and Radio Frequency Functions.

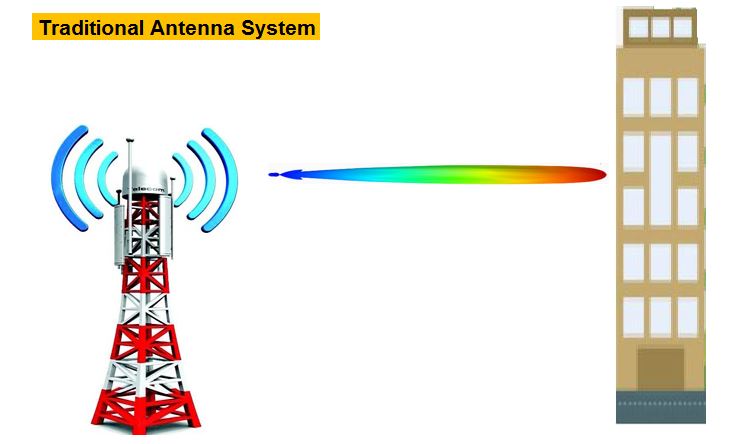
    In traditional antenna system we have to use separate Radio function unit and antennas.

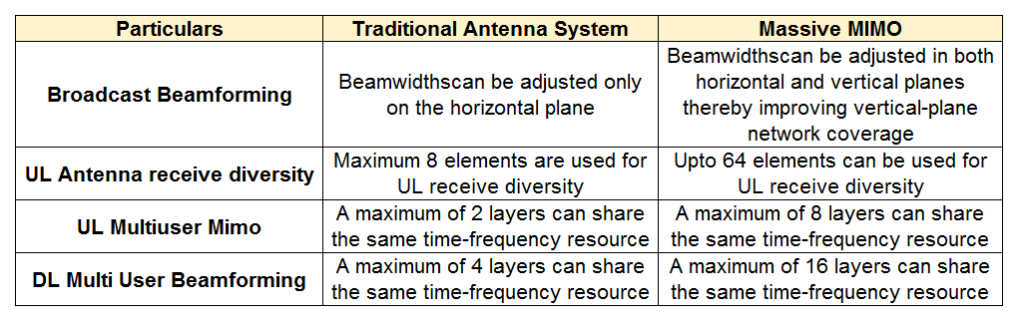
    Comparison Traditional Antenna System and Massive MIMO:

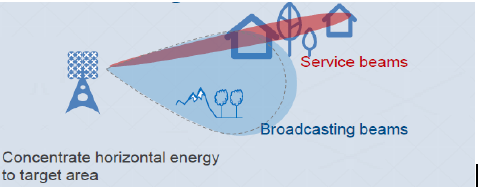
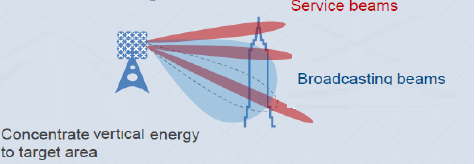
    We can have a pictorial view of Horizontal as well as Vertical coverage scenario of Massive MIMO for better understanding.

    Horizontal Coverage Scenario:

    Vertical Coverage Scenario:

    Benefits of Massive MIMO:

    • Massive MIMO improves cell capacity and Coverage
    • Increase User Experience.
    • Encourage Data Speed.

    Application Area of Massive MIMO:

    Squares, Stadiums and Big events:

    • Precise User specific beams
    • Effective Interference Control

    CBD Skyscrapers:

    • 3D MIMO for high floor coverage.

    Stations, Shopping Malls:

    • Concentrate user energy to combat propagation and penetration loss.

    Dense Residential, Universities:

    • Multi user MIMO to increase Cell capacity.

    Main Aim of using Massive MIMO are:

    Hotspot Coverage:

    In Hotspot area user density is very high. Demand of data is also very high. In such scenario Massive MIMO can improve system capacity through spatial multiplexing.

    By using Massive MIMO cell throughput increases and thus meet capacity demands in hotspot areas.

    Tall Building Coverage:

    With traditional site coverage in Tall buildings can’t satisfy as approximately vertical beam width is 7 degree.

    With Massive MIMO 35 degree Vertical beam width can be achieved to cover tall buildings.

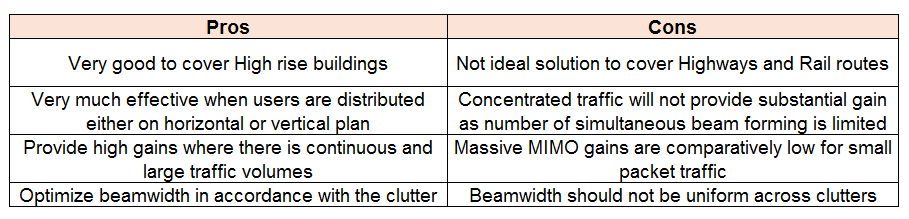
    Pros and Cons of Massive MIMO:

    Conclusion:

    I had introduced Massive MIMO technology in my earlier blog 5G Introduction where I have mentioned that Massive MIMO is one of the 5 building Blocks of 5G.

    It does not mean we have to use Massive MIMO in 5G only.

    We use Massive MIMO in LTE as well as 5G technology for better data handling and improved capacity.

    How Massive MIMO plays a vital role in 5G you should also read blog on

    5G Introduction.

    Pranabjyoti Hazarika

    BE | MBA | PMP|IoT-Certified

  • Model Tuning

    Model Tuning

    2nd Phase of Radio Network / RF Planning

    Once Continuous Wave (CW) testing is over and we are having required samples of field data then next step of Network/ RF planning is Model Tuning.

    In this blog we will discuss how we do Model Tuning in Atoll or other Planning Tool.

    This blog contains basic theory of Model Tuning and finally steps involved to do the Model Tuning in Planning Tool.

    Emphasize on to understand Model Tuning in a very simpler way through step by step approach of doing it in a Planning Tool like Atoll.

    If you still not going through my earlier blog on CW testing you should read it here, before going to Model Tuning phase.

    Basic Understanding of Model Tuning

    1st of all we should understand the basic of Model tuning, why do we do Model Tuning.

    In simple language Model Tuning is done to match the coverage distance of transmitted signal, in field and in Planning Tool for the same frequency and for similar kind of terrain and clutter.

    Suppose in field we have seen through our CW testing samples that in 2100MHz in a particular Urban area Received Signal Level (-93dBm) can travel a distance of 500m.

    Now our target is to set this 500m distance (for signal level -93dBm) in Planning Tool for a site which operates in 2100 MHz Band in similar Urban clutter.

    Here I am considering the same example as in Continuous Wave Testing (CW Testing) blog.

    Once Model Tuning is completed, a propagation Model is set and all future coverage prediction will be done based on the DESIGNED MODEL for a network.

    Model will be differently set for 2G, 3G, 4G-LTE or even for 5G based on use of different frequency band and Modulation techniques.

    Propagation Model and Formula:

    There are different types of Propagation Model based on different terrain and frequency range.

    Widely used Propagation Models are Okumura-Hata Propagation Model, Cost-Hata Propagation Model, ITU-529-3 Propagation Model and so on.

    Different Model has different characteristics.

    The Standard Propagation Model is a Propagation Model based on Hata Formula and is suited for predictions in 150 to 3500 MHz band over long distance (from one to 20Km).

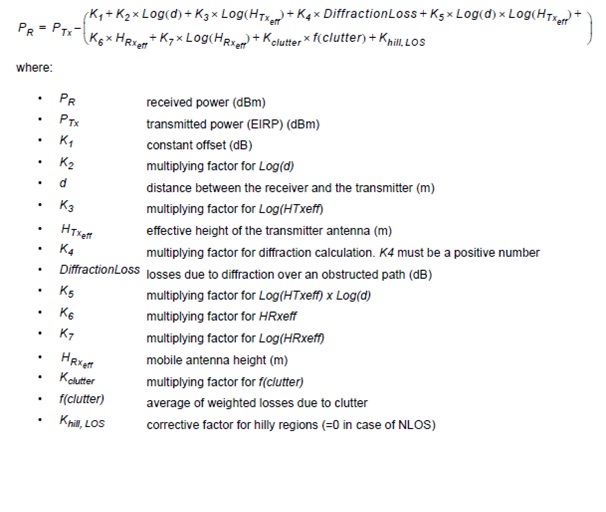
    Formula for Standard Propagation Model:

    Before seeing the formula just remember one thing, formula may be complicated but the actual process of doing it practically, is not that much complicated. It is simple. We should not bother much about formula. But before doing something at least we should know the theory why we are doing all these activities.


    Though this formula contains lot of factors, but almost all factors are known to us.

    E.g. We know Transmitted power how much we will transmit from a transmitter.

    Htx is height of the transmitter i.e. the Mobile Tower (Antenna Height e.g. 30m,40m etc.)

    Hrx is Height of receiver i.e. height of a human (UE) generally considered 1.5m and like this.

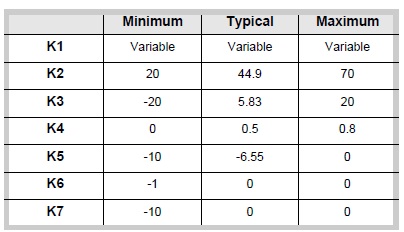
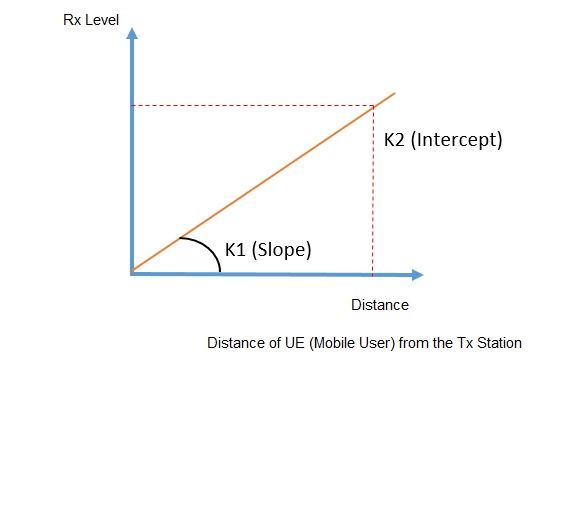
    Main 3 factors that we don’t know is K1 (Slope), K2 (Intercept) and D (Distance) between transmitter and Receiver.

    It makes a plot called Regression Curve where we take the Standard Deviation value.

    X-axis for the plot is Distance and Y-axis is Received Level (Rx Level).

    Regression Curve


    This curve is not exactly a straight line. Our main activity is to set different values for K1, and K2 to meet this kind of approximately straight line curve.

    Setting of K Values:

    So whole Model tuning is done by varying the values of K1 and K2 to get a required Model.

    We can do variations in other K values also for up to K7. But usually we prefer to change K1 and K2 values only.

    Setting of K1 and K2 to get a final Model is totally a trial and error method.

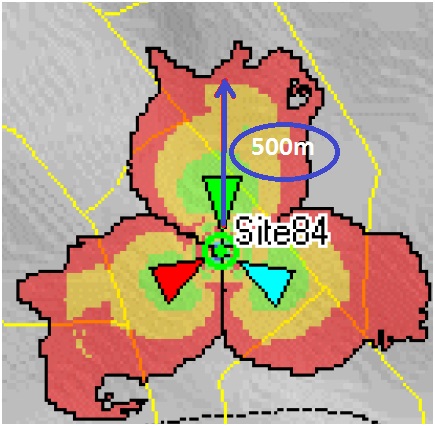
    Once in the Planning Tool, the required distance get covered (from the above mentioned example, e.g. 500m) for a particular frequency band (e.g. 2100 MHz band) in a particular clutter (e.g. Urban) for a particular received level (-93 dBm) then Model Tuning of one clutter (In this case Urban) is completed.

    Same process will be repeated for other clutter also like Dense Urban or Rural. Only difference is based on clutter the travel distance of -93dBms signal will increase or decrease from 500m.

    E.g. this distance will increase to 1.5Km in case of Rural instead of 500m in Urban.

    Process of Doing Model Tuning:

    Before start doing setting of K values we have to create different Projects in the Planning tool for different Technology.

    Separate Projects required creating for 2G, 3G, 4G-LTE or for 5G.

    In each projects different parameters set for different technology.

    E.g. Modulation techniques will be different for GSM, UMTS, LTE and 5G.

    Suppose 2 technologies operates in same frequency band, e.g. in 1800 MHz band we are operating both 2G and 4G.

    In this case though both technologies are operating in the same frequency band, yet their modulation technique will be different.

    So the planning tool will do the coverage prediction based on their defined project and though both are in same band still the coverage distance for same signal strength will be different.

    Sample Types:

    Samples through CW Testing:

    In conventional CW testing collected samples shows only the Carrier Signal Strength.

    These are unmodulated signals. It contains only RX Power and Latitude & Longitude of sample collected locations.

    With these samples we can’t differentiate technologies. It will give same details for 1800MHz band regardless of 2G or 4G.

    Samples through existing SIM:

    If we collect samples through a SIM of any existing network, collected samples are modulated signals.

    So we will get a difference of coverage in collected samples for same frequency band but for different technology.

    In our case suppose 1800MHz band for 2G and 4G same signal level but different travel distance.

    Step by step process:

    • Data/ Samples collected through conventional CW testing or through Drive Test (with Existing SIM) are imported in Planning Tool like Atoll.

    We can import the same in other planning tools too.

    Let’s see 1 sample data as we mentioned in CW testing.

    • Here we have seen that a signal level of -93 dBm is travelling to a distance of 500m in an Urban area (Say Frequency band 2100MHz for 3G).
    • Now we have plot a site in Atoll Planning Tool at the same Latitude and Longitude where we set our Transmitter/Mobile Tower during CW testing.
    • We already made a Project for 3G in Atoll with all different parameters. Main difference of Parameter will be Modulation Techniques for different Technology.
    • So now Atoll itself has some “K” values for the created Project.
    • Run a prediction for the sample site by selecting only 1 site.
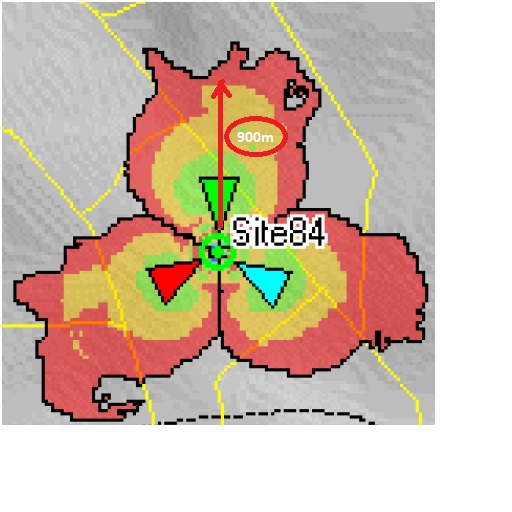
    • The tool will show its own coverage area for the site based on the data available in the Project.
    • This prediction value may or may not match with the actual data we have collected in field.
    • In Planning tool let us define 3  signal level category

    Green: -72 dBm

    Yellow: -72 to -93 dBm

    Red: -93 to -120 dBm

    In Tool we can define any no of Signal Level category based on our requirement.

    For simplicity here we are ignoring the GREEN level and will consider YELLOW for -93 dBm.

    And also keeping the 3 sectors of the site in 0/120/240 degree.

    • For example we consider that the prediction given by planning tool shows that -93 dBm signal i.e. YELLOW travels up to 900m distance.
    • Now our main task is to change the “K” values mainly K1 and K2 until we reduced the distance of -93dBm signal from 900m to 500m for this particular site.

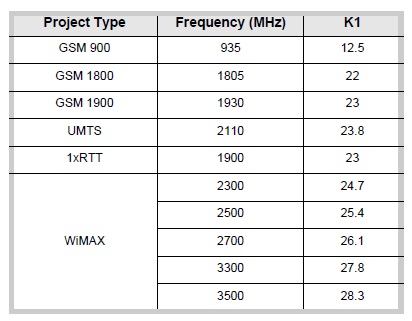
    Sample Values for K:

    Some Possible values of K are-

    K1 Value is depends upon Radio Frequency and Radio Technology:

    • Changing of K values are not like 1 time activity.
    • It is a trial and error method.
    • We would vary the “K” values until we reach the value of 500m distance coverage for -93 dBm signal.
    • Every time after setting new “K” values we will run a Prediction Coverage.
    • Then will check what the travel distance is.
    • This Process will be repeated until we find some “K” values which shows a prediction of 2100MHz band, signal level -93dBm is covering up to a maximum distance of 500m.
    • These values like 500m, -93dBm will be as per our requirement. These are not some specific values.

    These are taken here just for example purpose only. E.g. for dense Urban 500m will change to 300m.

    So accordingly we will do all “K” value settings so that -93dBm (or -73 dBm as per our requirement) signal level would travel up to 300m only.

    So by repeating the process of “K” value change we can finally reach to a DESIGN in Tool where coverage of signal level is same both in actual field and also in Planning Tool.

    This is MODEL TUNING.

    Once one design is done for a clutter (in this example Urban) we will do the same process for all other different clutters i.e. Dense Urban, Semi Urban and Rural.

    When DESIGN is completed for all types of clutter the Model Tuning for the whole Network is completed.

    Now we can put “n” no of sites in the tool defining which sites will fall in which clutter type (Urban, Rural etc.). The Tool will give an appropriate coverage for the whole Network.

    So now we can plan how many sites will be required to cover a particular town or area based on the prediction plot.

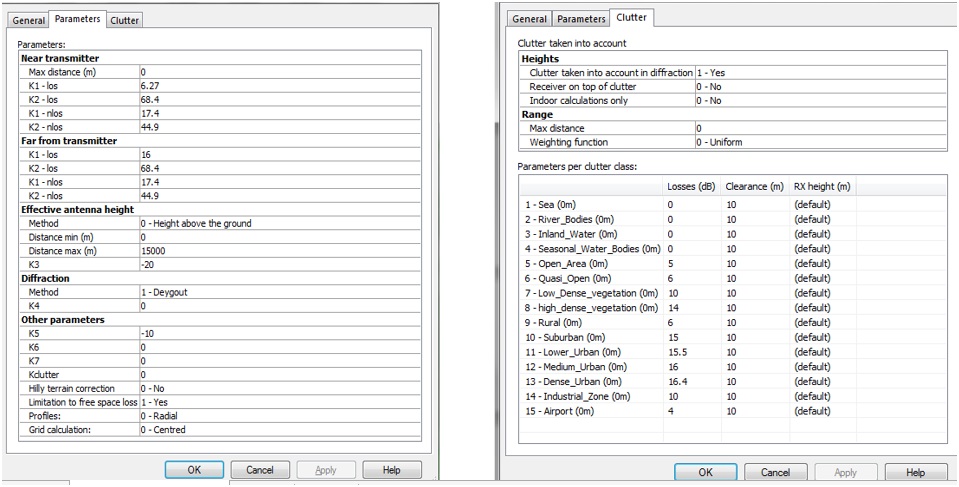
    Here is a sample setting of Clutter and Parameters for a Design of 2100MHz 3G in Urban area:

    I am not saying that this is an ideal / correct setting for 3G- 2100 MHz band in urban area.

    This is one example I did during my 3G Greenfield project to get the required design.

    In a separate article we will discuss another method of Model Tuning for an existing Network with the help of MRR report.

    Do you think there are some points I missed here? Leave a comment below.

    I would like to hear from you.

  • CW Testing- Continuous Wave Testing

    CW Testing- Continuous Wave Testing

    CW testing is Continuous Wave Testing.

    CW testing is the First Phase of Telecom/Mobile Network/Radio Frequency (RF) Planning.

    Network Planning/ RF Planning is always start with Continuous Wave Testing Method for all GREENFIELD project.

    The main aim of doing CW testing is to gather information to design a propagation model of transmitted signal for mobile communication.

    It is carried out to gather actual propagation of mobile signals in different terrain and clutter.

    Basic of doing this test is to measure or to know the actual distance, a transmitted signal would travel from a Mobile Base Station that we simply say MOBILE TOWER or SITE.

    Propagation Model primarily depends on geography and terrain of a circle.

    Secondly it also depends on clutter type e.g. Dense Urban (High rise congested buildings), Urban or Rural area.

    This is the traditional method and best method for Model Tuning/Model designing.

    This is applicable for all technologies that may be 2G, 3G, LTE or 5G. It is mainly Spectrum dependent test.

    With the help of CW testing and Model tuning we can design a model for our network to generate coverage prediction and network planning.

    Quality of any network depends on the accuracy of the Propagation Model designed based on CW testing and Model Tuning.

    Basic concept of CW testing is very simple-

    1. It has one transmitter along with Omnidirectional antenna which will transmit frequency of corresponding licensed frequency (e.g. 1800Mhz, 900MHz band)
    2. A receiver (Drive test kit) will move around the transmitter and checked for signal strength. How far the Receiver can receive signal from the static transmitter.

    Set up of CW Testing:

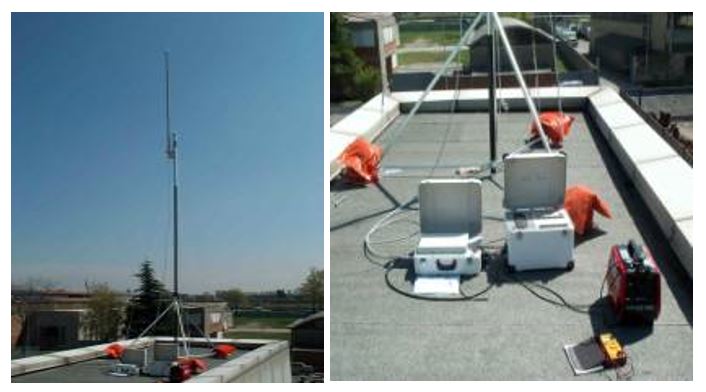
    The CW testing equipment contains-

    1. Transmitter
    2. Omnidirectional Antenna.
    3. Power supply to provide power to the transmitter.
    4. Drive test Kit as a receiver.

    Now there are two Scenarios for CW Testing.

    Scenario-1:

    Suppose in a telecom circle or LSA (usually a state e.g. Assam Circle, Maharashtra Circle) there is no Operator is having a new technology (e.g. 4G-LTE or 5G)

    When we are planning to start this new technology (e.g. 4G-LTE or 5G) or new frequency band (e.g. 2300MHz, 2100MHz band) in that telecom circle we first have to

    Start with Continuous Wave Testing (CW) method.

    Then we will use the above mentioned equipment for doing the CW testing.

    In transmitter we can set our required frequency to radiate (e.g. 2300MHz band).

    Scenario-2:

    Suppose in a Telecom Circle Operator-A is already giving service of 4G in 2300MHz band.

    Operator-B is a newcomer and planning to start 4G network in same frequency band 2300MHz in that same circle.

    In this case we do not require to set up the transmitter for radiating the licensed frequency band.

    Instead we can use a SIM of Operator-A and do the drive test to check actual coverage level.

    In that case we do not require the CW testing set up as the existing operator’s SITE (BTS/nodeB/eNodeB) will do the actual transmission of signals.

    Drive test will be carried out by using existing operator’s SIM card.

    But if Operator-A is providing services in 2300MHz band and Operator-B is going to operate 4G in 2500MHz band then this method will not work.

    We can use SIM card method only for same frequency band.

    For different frequency band we must go for normal Continuous Wave testing method with Transmitter+Omnidirectional antenna.

    Data Collection by Drive test Method:

    The transmitter should place in such a location that it is at the top of a high rise building or some high rise locations from where Omni-directional antenna can radiate to a maximum distance.

    Drive test need to carry out in different clutter e.g. Dense Urban, Urban and rural area.

    Propagation of signal will be different in different clutter based on penetration losses.

    Collection of Samples and Plotting:

    In CW testing we would collect samples with the help of drive test kit.

    Collected samples can be easily imported in MapInfo Tool. For Final Model Tuning we will use Atoll Planning Tool.

    For initial check of collected samples and to analyse the signal quality it is better to use MapInfo as it is fast and simple to operate.

    We will discuss about MapInfo tool separately. You can visit my youtube videos to know basic of MapInfo functionality.

    https://www.youtube.com/user/hazarikap  (Pranabjyoti Hazarika)

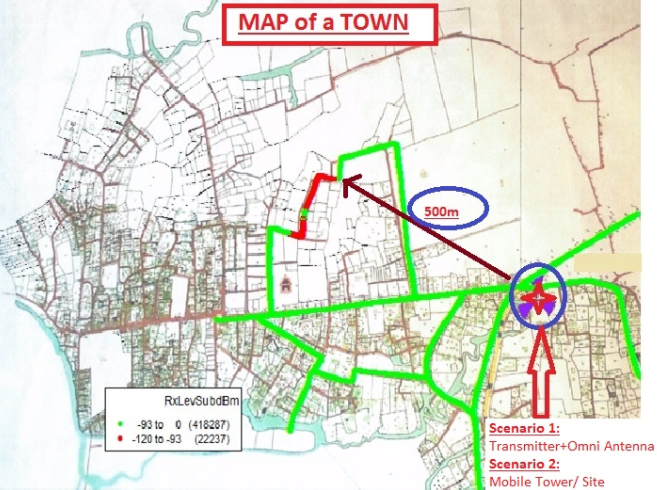
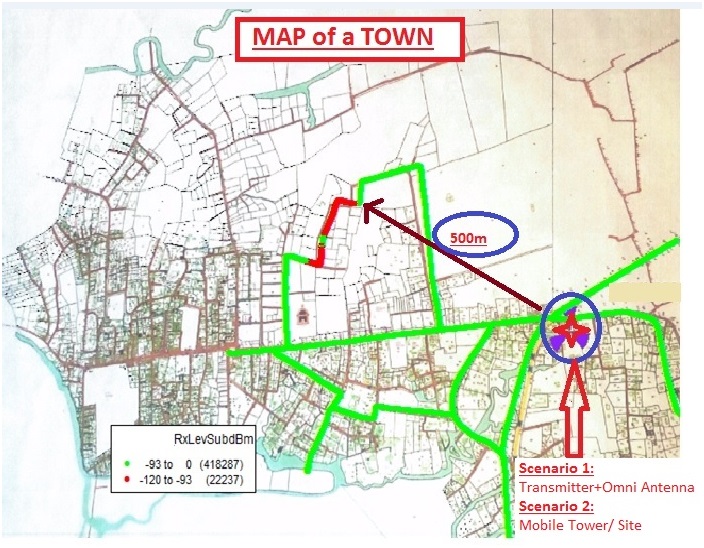
    In the above picture it is showing that Transmitter is placed in a fixed position and transmitted a frequency band say 2100MHz (Suppose 5MHz frequency range in 2100MHz band)

    The Drive test car with kit were roaming in the town on the motor-able roads.

    We have bifurcated all the collected samples in two different parts.

    1. Good Quality received signal : received level from 0 to -93 dBm (Color GREEN)
    2. Poor Quality received signal : received level from -93 to -120 dBms (Color RED)

    Now we can see that till 500m distance we are getting GOOD signal level (Color GREEN) in that particular area of a Town.

    Beyond 500m distance in some areas we got POOR signal (Color RED).

    If we consider this part of the town as URBAN, then we can come to a conclusion that for URBAN area we will consider coverage of a site till 500m distance in 2100MHz band.

    If we do 4, 5 sample test in 4, 5 different URBAN areas of different towns then accuracy of the conclusion of coverage prediction will be improved.

    But still with 1 sample test also we can conclude to a good value.

    Clutter wise sample collection:

    So we have completed CW testing and sample collection in 1 clutter, i.e. URBAN

    Now we will identify a location of the same town or in different town with high rise congested building area as DENSE URBAN.

    In DENSE URBAN we may get a GOOD signal level travelling to a distance of 300m instead of 500m.

    In RURAL area this distance may increase upto 1.5Km, 2Km or may be upto 4Km depending on the band of Frequency.

    More Frequency band less travelling distance because of more losses in high frequency.

    E.g. 900MHz band signal may travel upto 4Km in rural area, whereas 1800MHz band can travel upto 2 to 2.5 Km.

    So now we are having collected data/ samples for all 3 category of clutter i.e. DENSE URBAN, URBAN and RURAL.

    We also come to a conclusion that with suppose 2100 MHz band we are getting GOOD signal strength

    For DENSE URBAN-300m

    URBAN-500m

    RURAL-1.5 Km

    Drawback of CW Testing:

    Drawbacks of CW testing are

    1. CW testing model tuning is based on outdoor coverage only. We don’t collect samples inside a building to measure indoor coverage.
    2. Time taking method.
    3. Lot of iterations.
    4. Analogous Transmitter.

    Rest it is the best method of sample collections for Model tuning.

    In next blog we will discuss about MODEL TUNING which is the 2nd Phase of Network/ Radio Frequency (RF) Planning.

  • What is MRO in Telecom

    What is MRO in Telecom

    MRO-Minimum Roll-out Obligations

    The full form of MRO in telecom is Minimum Roll out obligations.

    When an operator gets operating licence for a particular frequency band, e.g. 1800 MHz band then that operator has to comply Minimum Roll-out Obligations.

    Here operator has to do roll out (site roll out and provide network services) in District Headquarters (DHQ), Block Head Quarters (BHQ), Towns or SDCAs** (Details of SDCA is mentioned in the end of this blog) based on different frequency band.

    The test procedures and the roll out phases all are set by Department of Telecommunications (DoT).

    The License owner shall make its own arrangements for all infrastructures involved in rolling out of the network and shall be solely responsible for installation, networking and operation of necessary equipment and systems.

    MRO compliance is not accepted if done by using technology of network sharing Intra Circle Roaming. 

    (This roll out obligation is separated in phases and in each phase no of DHQ, BHQ or towns to be covered is different.

    Suppose in a circle there are 33 districts, then to meet 1st phase of MRO-10% DHQ roll out obligation an operator has to complete services in 4 DHQs.

    10% of 33 DHQs is 3.3. We can’t do 3, instead we have to complete 4 District Head Quarters.

    Any operator which is failed to meet any phase of MRO will attract huge penalty.

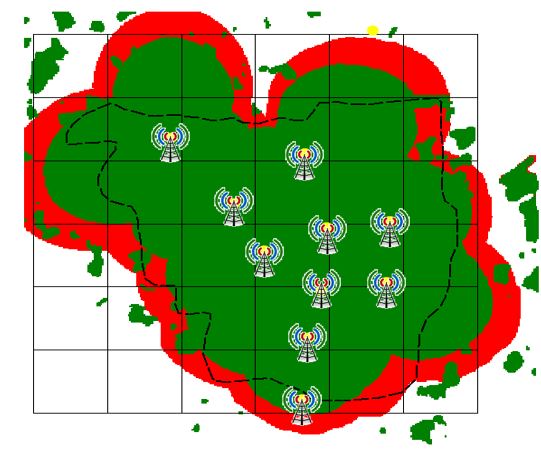
    In the above picture GREEN colour shows acceptable coverage area for a particular DHQ/BHQ/Town boundary.

    Planning, testing procedures and details of reports and other related things of MRO we will discuss separately.

    Here let us first discuss what are the phases we have to obey for Minimum Roll-out Obligations and finally about penalty details.

    Phases of MRO:

    For 700 MHz, 800 MHz, 900 MHz & 1800MHz bands:

    1. For Non Metro Licensed Service Area (LSA or Circle)

    Phase 1: Coverage of 10% District Headquarters (DHQ)s/ Towns by the end of first year.

    Phase 2: Coverage of 50% DHQs/ Towns by the end of three years.

    Phase 3: Coverage of 10% Block Headquarters (BHQ)s by the end of third year.

    Phase 4: Coverage of additional 10% BHQs (Cumulative 20% BHQs) by the end of fourth year.

    Phase 5: Coverage of additional 10% BHQs (Cumulative 30% BHQs) by the end of fifth year.

    For all cases time duration is considered from effective date of license or date of assignment of spectrum whichever is later.

    2. For Metro Licensed Service Area (LSA or Circle)

    The roll-out obligations for coverage in metro LSAs shall be coverage of 90% of the LSA within one year from the effective date of license or the date of assignment of spectrum, whichever is later.

    For above two cases frequency band 900MHz and 1800MHz are treated as same.

    For 2100MHz band:

    1. For Non Metro Licensed Service Area (LSA or Circle)

    Phase 1: 50% of DHQs in the LSA out of which 15% of DHQs should be in rural SDCA within three (3) years.

    Phase 2: Additional 10% of DHQs in the LSA within four (4) years.

    Phase 3: Additional 10% of DHQs in the LSA within five (5) years.

    For all cases time duration is considered from effective date of license or date of assignment of spectrum whichever is later.

    2. For Metro Licensed Service Area (LSA or Circle)

    The licensee required to provide required street level coverage using the spectrum in 2100 MHz in at least 90% of the LSA within five (5) years from the effective date of license or date of assignment of spectrum,whichever is later.

    For 2300 MHz and 2500 MHz bands:

    1. For Non Metro Licensed Service Area (LSA or Circle)

    The licensee of 2300 MHz / 2500 MHz shall ensure that at least 50% of the rural SDCAs are covered within five (5) years of the Effective Date using 2300/ 2500 MHz band of license or date of assignment of spectrum, whichever is later.

    2. For Metro Licensed Service Area (LSA or Circle)

    The licensee is required to provide street level coverage as prescribed in the test schedule in at least 90% of the LSA within five (5) years of the Effective Date of license or date of assignment of spectrum, whichever is later.

    Penalty in MRO:

    Any Operator or License owner fails to comply Minimum Roll-out Obligations, it attracts phase wise huge penalty.

    The penalty is applicable for each phase separately. If an Operator fails to meet prescribed period of time for two phases, then below mentioned penalties will be applicable twice.

    For 700 MHz, 800 MHz, 900 MHz,1800MHz & 2100MHz bands:

    1. @ Rs. 5 Lakhs per week for first 13 weeks.
    2. @ Rs. 10 Lakhs for the next 13 weeks and thereafter
    3. @ Rs. 20 Lakhs for 26 weeks

    subject to a maximum amount of Rs. 7.00 Crores for each phase.

    For 2300 MHz and 2500 MHz bands:

    1. @ Rs.15 Lakhs per week for first 13 weeks.
    2. @ Rs. 30 Lakhs for the next 13 weeks and thereafter
    3. @ Rs. 60 Lakhs for 26 weeks

    subject to a maximum amount of Rs. 21.00 Crores for each phase

    For each of the above two cases delay more than 52 weeks in a phase will impose maximum penalty amount and assigned spectrum may also be withdrawn.

    **SDCA:

    Short Distance Charging Area (SDCA) is a telecom area which is smaller than the size of a district.

    DoT (Department of Telecommunications) configures entire telecom network in India in to Telecom Circles (LSA).

    Circles are further categorized into Switching Area (SSA) and Long Distance Charging Area (LDCA) which is equivalent to size of a district.

    LDCA is further divided into Short Distance Charging Area (SDCA) which is smaller in size than district and Taluka.

    ## Reference: Notice Inviting Application (NIA);No: 1000/06/2016-WF

  • Difference between MORAN and ICR

    Difference between MORAN and ICR

    In my earlier two blogs about MORAN (Multi Operator Radio Access Network) and ICR (Intra Circle Roaming) we have discussed about how MORAN and ICR can be used for coverage expansion.

    Both technologies are used for sharing of network between two operators.

    There is always a seeker and a provider network.

    For the seeker operator the ICR or MORAN sites are new sites for their network.

    If both technologies can be used for coverage expansion then why we use MORAN in some cases and ICR in some other cases.

    There are some major difference we found when we implement these technologies practically.

    For theoretical concept you please go through my earlier two blogs of MORAN and ICR-Intra Circle Roaming.

    MORAN and MRO:

    One major criterion when we use MORAN instead of ICR is Minimum Roll Out Obligation (MRO).

    MRO is Minimum Roll out obligation that is set by DoT (Department of Telecommunications).

    When an operator gets operating licence for a particular frequency band, e.g. 1800 MHz band there is an obligation set by Government that the Operator has to do roll out (site roll out and provide network services) in District Headquarters (DHQ) and BlockHead Quarters (BHQ).

    This roll out obligation is separated in phases and in each phase number of DHQ or BHQ to be covered is different.

    E.g. 1st phase of DHQ roll out obligation required 10% coverage of total DHQs.

    Suppose in a circle there are 33 districts, then to meet 10% DHQ roll out obligation an operator has to complete services in 4 DHQs.

    10% of 33 DHQs is 3.3. We can’t do 3, instead we have to complete 4 District Head Quarters.

    Minimum Roll Out Obligation (MRO) itself is a huge topic. I shall discuss this topic separately.

    For now we understood that after getting License Telecom Operator has to complete minimum roll out in some areas as per DoT (Department of Telecommunications) guidelines.

    In the end final testing for Quality check of  coverage of network of the operator in District Head Quarter (DHQ) or Blok Head Quarter (BHQ) is conducted by TERM Cell (Telecom Enforcement Resource and Monitoring).

    During testing TERM Cell representative check the received signal in Drive Test tool.

    In drive test tool it shows through which ARFCN (Absolute Radio Frequency Channel Number) we are getting received signal.

    ARFNC is directly related to frequency spectrum.

    So if we want to complete MRO in a town/ DHQ/BHQ with the help of Network sharing from other Operator we must adopt MORAN (Multi Operator Radio Access Network) instead of ICR (Intra Circle Roaming).

    In MORAN only, we use PLMN/ BCCH+TCH of the seeker network. But in ICR we use PLMN/ BCCH+TCH of Provider network only.

    So during final testing of MRO it will clearly visible ARFCN/BCCH of the seeker network if we use MORAN.

    But in ICR case, testing will be failed as it will show ARFCN/BCCH of provider network only.

    This is one major noticeable point in MRO, where we must go for MORAN in lieu of ICR.

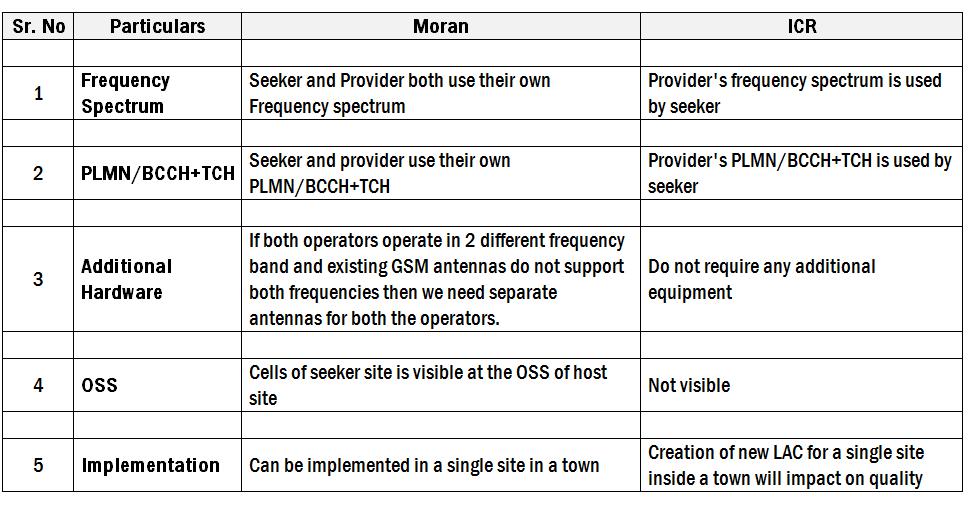
    There are some basic noticeable differences between MORAN and ICR when we see practical implementation of these technologies.

    Some points are tabulated below-

    There are lot many differences during configuration and design of MORAN and ICR.

    For more details you may please visit my other blogs on MORAN and ICR-Intra Circle Roaming.

    So MORAN and ICR both can be used for coverage expansion based on different scenario.